Datorama Dashboards and Rich Text Widgets
Let us walk you through different sections in the Rich Text Widgets with its respective functionalities and how it can be used to create Datorama dashboards with custom visuals.
The Rich Text or custom widget comes with an interesting list of ‘out of the box’ features. It makes your dashboard dashboards more interactive and AI driven, enabling you to explore many possibilities and use specific ideas about how you want to visualize your data. What started off as a simple way to add notes to your dashboard, can now use HTML, CSS and JavaScript to pull Query from data streams and style your text along with other visual elements of the dashboard. It also allows you to add myriad HTML tags, embed iframes, and custom CSS to widgets. See our examples of custom Datorama dashboards.
Datorama Dashboard Examples using Rich Text Widgets
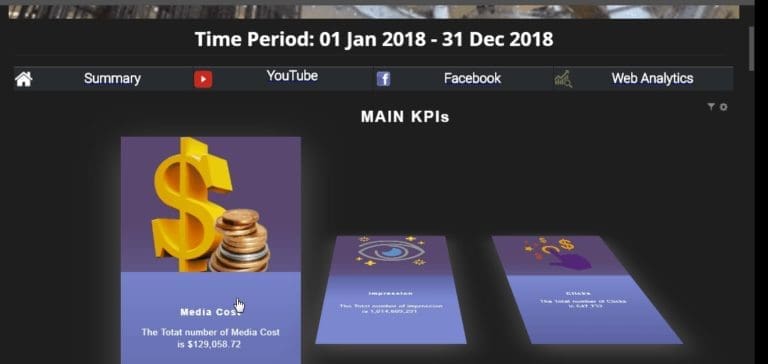
The Rich Text Widget in your Datorama Dashboard has 3 main sections to help you create custom, signature visuals:
- Editor section: Here the display is set according to the content that is added in the Editor section i.e. Text, Tokens and Formatting.
- Query section: The Query section includes all the Dimensions and Metrics to be pulled to visualize data in the Rich Text Widget display.
- Sorting section: This section includes options to check the display based on the pulled measurements.
Datorama’s Rich Text Editor Explained
The Editor Section has two options:
- Basic Editing option.
- HTML Editing option.
Rich Text Basic Editing Options
This option supports the use of text, tokens and advanced formatting options to add images and videos on your Datorama Dashboard.
The available Query Tokens are:
- Dimension Token {Query.Dimension Name} – This will display all the Dimension values available in the Widget.
- Measurement Token {Query.Measurement Name} – This will display all the Measurement values available in the Widget.
- Filter Token {Filter.Dimension Name} – This will display all the Filters applied to this Widget.
- JSON Token {Query.JSON} – This will display all the Dimensions and Measurements in a JSON format.
- Table Token – {Query.Table} – This will display all the Dimensions and Measurements in a table format.
The Filter Tokens that display all the filters can be preset.For example:
- {Filter.Start/End Date} – This will display the Start Date and/or the End Date which is affecting the Widget.
- {Filter.Campaign Name} – This will display the Campaign Names the Rich Text Widget is filtered by.
Data Onboarding and Connectivity that Works
In the Basic Editing option, the background color and/or a transparent background can be set.
The Query Tokens will retrieve all available values for that respective query.
For example, the following Widget settings:
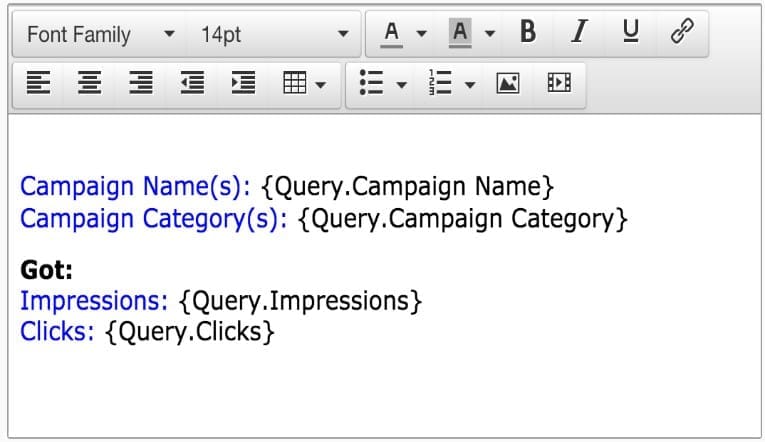
will generate the following display:
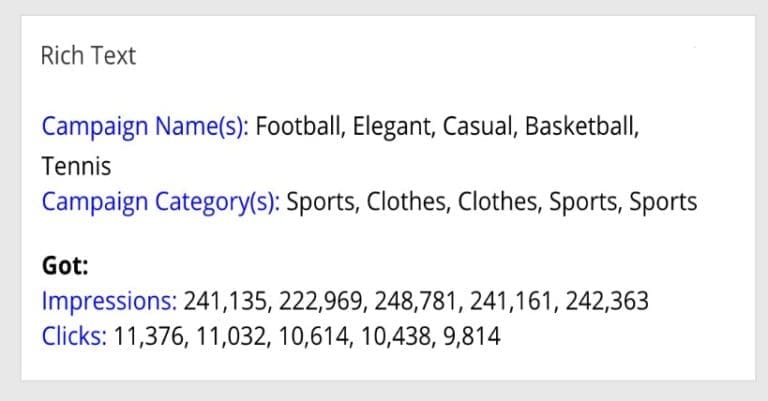
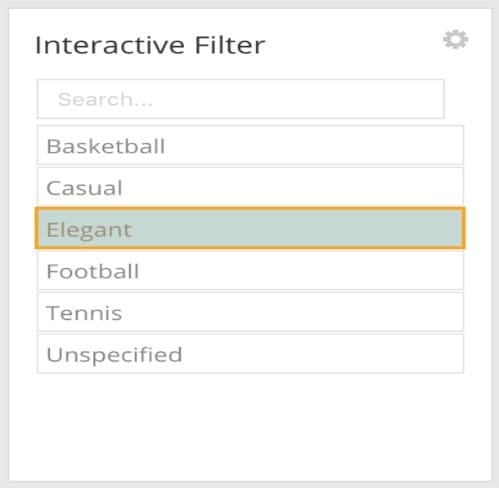
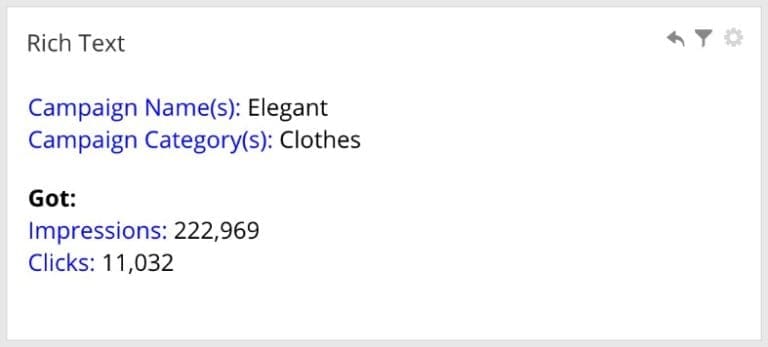
To display only specific values, you can either use the Interactive Filter Widget or apply a Widget Filter on the Rich Text Widget.
For example:
Custom Datorama Dashboards using the Rich Text HTML Editor
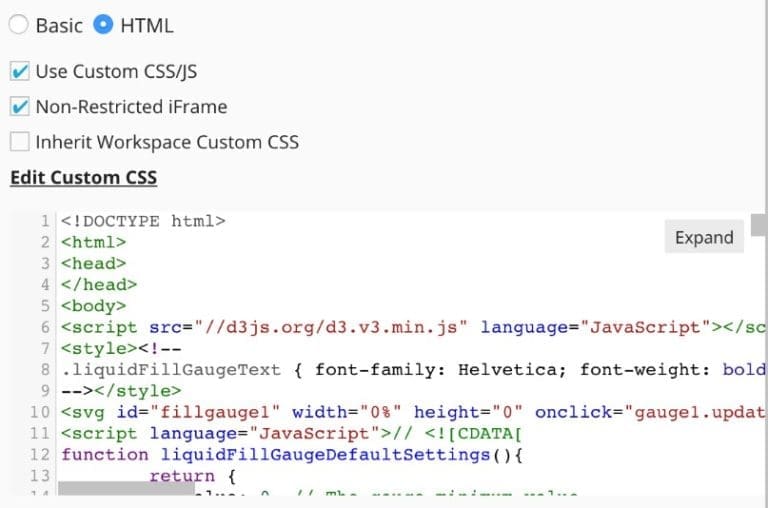
This option supports the use of advanced components such as HTML, CSS, and JavaScript to create your Custom-Visuals. To display these advanced components, check the Use Custom CSS/JS checkbox. Auto-complete is available according to the component you are editing, i.e. when entering HTML syntax HTML auto-complete will be available to you. Note that Query Tokens do not have auto-complete when in HTML edit mode.
When Applying CSS you can enter the desired syntax and also use the Workspace custom CSS by checking the Inherit Workspace Custom CSS checkbox.
In the example below, a script for the visualization was embedded and the Datorama Measurement CTR was implemented into it. (note that while embedding scripts, HTTP has to be changed to HTTPS):
Query Section
In this section, you can enter the Dimensions and Measurements you wish to visualize in the Widget’s display. Every Dimension and any measurements you include in the Editor section must also be entered in the Query Section.
In the Single Token Settings field, you can pick your preferable display method – Concatenate Values / Regular, Bullet / Numbered List format.
When choosing Concatenate Values, the display will be a string of values separated by a separator of your choice.
By default, the display will include total values. You can remove total values by unchecking the Totals checkbox.
For further assistance on how to explore Rich Text Widget for your Custom-Visuals for appealing dashboards in Datorama, please feel free to connect with us.
Datorama Dashboard’s dynamic queries in a Rich Text Widget can boldly showcase important numbers and display real-time KPI values at a glance. So any KPI is a perfect use case for this feature.
The potential possibilities to create Custom-Visuals in your Datorama Dashboard using Rich Text Widgets are limitless. The Widgets support addition of text for headers on the page and along with that, its custom visualization using HTML, CSS and JavaScript code enhances the dashboard. It also supports ‘Iframe’ with ‘php’.
However, other scripting languages like CGI, Perl, python, Ajax, jQuery and others are not supported by the Rich Text Widget.
Looking to develop something custom and need a little bit of help building it? Contact DF, today.


