While Datorama isn’t a BI platform, drilldown reporting is another way to interact further with your dashboard visuals. Users can instantly visualize granular levels of data within a widget and without moving into a different page or section. Further, a recent update to the platform now provides visual pivot tables to help advertisers better explore data.
We’ve argued that Datorama has exceptional data management tools, and underrated visual communication capabilities, but it should not be considered a traditional BI platform. However, similar to traditional BI tools like Looker, Sisense, PowerBi and Tableau, Datorama does provide ETL support, data visualizations, dashboards, and data analysis in the form of drill-downs to interact further with widgets, pages, and reports. This is a forgotten Datorama reporting feature, but users can instantly visualize granular levels of data within a widget without moving into a different page or section and now, we’ll show you how to do it.
To perform this drill down, Datoramarequires a “Hierarchy” of dimensions within a bar or pie chart.
Let’s say, for instance, you have Facebook Ads running across different regions in different languages. In Datorama, you have Conversions recorded by Facebook Ads, Targeting Language, and Offers. Thanks to Datorama’s data model, conversion figures are easily summarized at the Targeting Language level and visualized in a dashboard using a bar or pie chart.
If you had an option to drill down a Targeting Language that outperformed the other languages in terms of Conversions, it would be useful to see the Offers that those Ads were promoting. Users can dive deeper into the Ad-sizes that fetched maximum conversions — all in one widget!
Follow along with this guide to help you gain a more in-depth insight into your data. To start, let’s create a Hierarchy in Datorama.
- Go to Connect & Mix > Select Dimensions > Hierarchies
- Create a new Hierarchy by clicking Add New
- In Datorama, this new Hierarchy will have three mapped dimensions, i.e., Targeting Language, Ad Offers, and Ad Sizes.
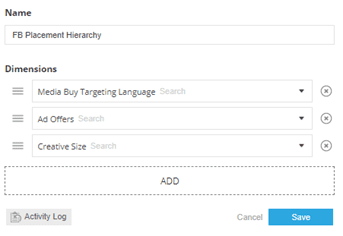
Go to Connect & Mix > Select Dimensions > Hierarchies
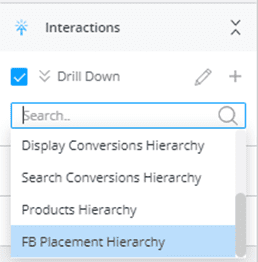
In the Design Tab of a bar chart, go to Interactions > Drilldown. In the drop-down list, you will see all the existing drilldowns and select the newly created Hierarchy.
Now, click on a bar chart representing a Targeting Language. Its tooltip will have an option to activate Drilldown (as shown in the image below)
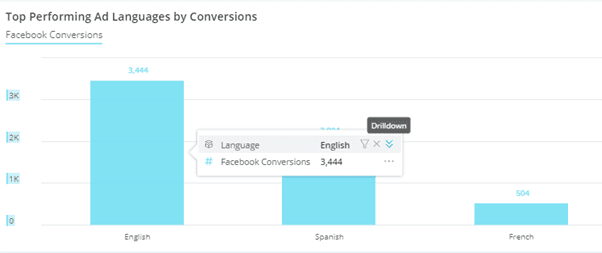
Clicking on the ‘Drilldown’ icon will allow you to view Ad Offers associated to the Targeted Language. All of the Targeted Languages appear as a dropdown filter embedded on top of the bar chart.
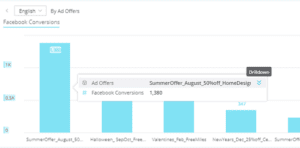
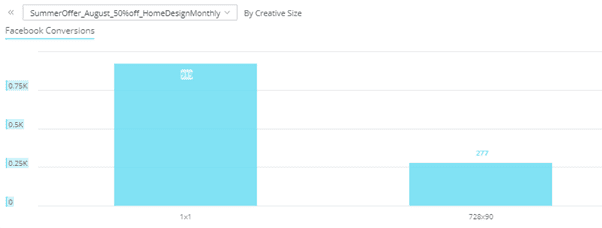
Clicking on the chart of a top-performing Ad Offer will allow you to further drill down into top-performing Ad Sizes. All the Ad Offers are available as a dropdown filter.
Through the drill downs and data exploration feature, Datorama now answers several questions and provides instant insights on different granularities of data.
About Decision Foundry
Decision Foundry is a Salesforce, independent software vendor, managed services provider, and a certified award-winning Salesforce Marketing Cloud integration partner. Decision Foundry closes the gap between data accessibility, platform adoption and business impact. Our consulting services include the integration of Data Cloud, Account, Engagement, Personalization, Tableau, and Intelligence.


