Key Highlights
- Big data analytics is transforming business intelligence, leading to smarter decisions and improved strategies.
- By analyzing vast amounts of data, companies gain valuable insights into customer behavior, market dynamics, and operational efficiency.
- Business intelligence tools equipped with big data capabilities offer predictive analytics, forecasting future trends, and revealing hidden patterns.
- Implementing big data solutions requires strategic planning, the right tools, and a skilled workforce to manage the unique challenges and opportunities.
- Building a data-driven culture that encourages employees at all levels to embrace data-informed decision-making is crucial for success.
The Evolution of Business Intelligence
Picture a 1980s executive boardroom: Leaders huddle around thick binders of sales reports and market analyses, piecing together the story of their business through static numbers and quarterly summaries. Fast forward to today, where real-time dashboards pulse with live data, algorithms detect subtle market shifts, and predictive models forecast tomorrow’s opportunities. The transformation of business intelligence over the past few decades tells a fascinating story of how technology has revolutionized corporate decision-making.
This shift from paper-based analysis to sophisticated digital systems didn’t happen overnight. Each technological leap – from the first databases to today’s AI-powered analytics – solved critical business challenges while creating new possibilities. Understanding this evolution helps us appreciate not just how far we’ve come, but where business intelligence might take us next.
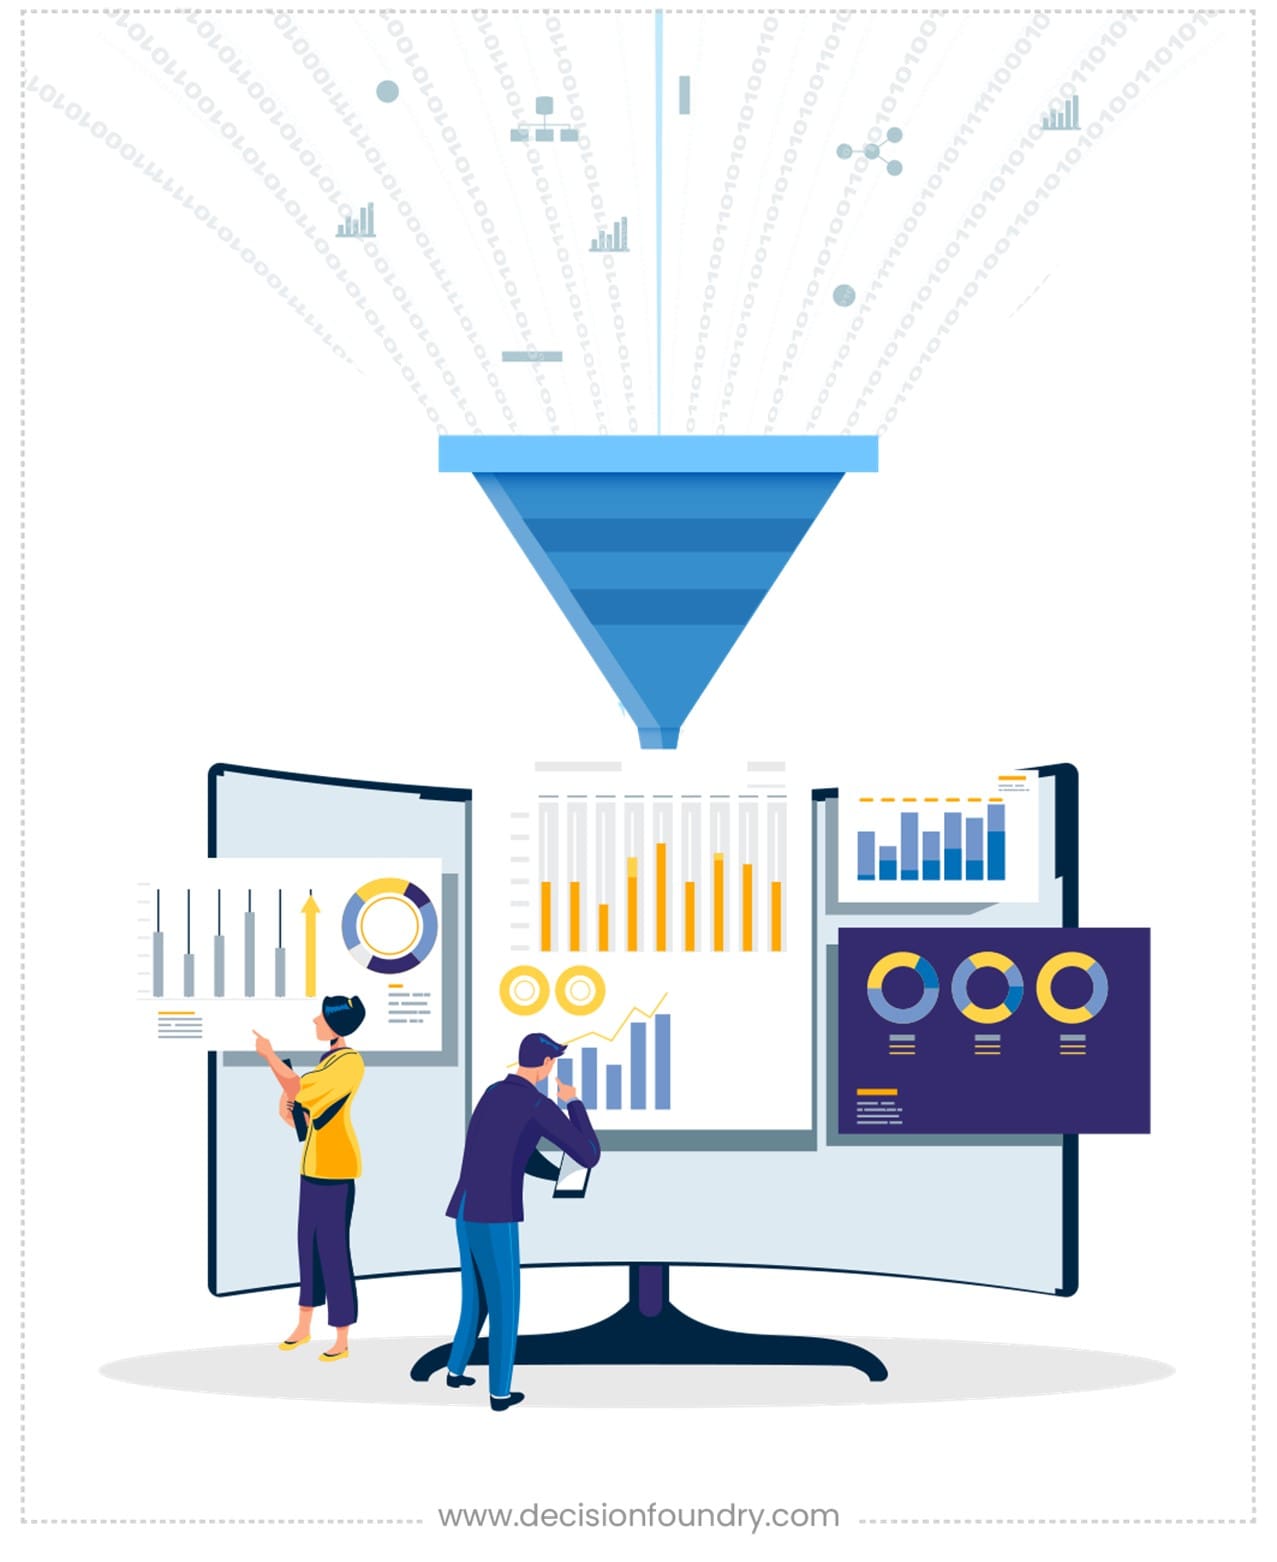
From Traditional Data Processing to Big Data Analytics
As businesses began generating unprecedented amounts of digital information, the old ways of processing data fell short. Spreadsheets and simple databases that once seemed cutting-edge couldn’t handle the sheer volume of information flowing through companies’ digital systems.
Big data analytics emerged as the answer to this challenge. This approach helps companies make sense of vast datasets that include everything from sales records to customer emails, social media activity, and equipment sensor readings. By examining all these sources at once, analysts can spot hidden patterns and connections that guide better business decisions.
Companies now use these tools across their operations: understanding customer behavior, spotting market changes, fine-tuning supply chains, and finding new business opportunities. These insights lead to smarter choices and a clearer picture of how different parts of a business affect each other.
Key Milestones in the Development of Business Intelligence
Several key developments shaped how businesses collect and understand their data. Better ways to visualize information made complex patterns clear to everyone from analysts to executives through easy-to-read charts and interactive displays.
Data mining became essential as companies sought to understand the wealth of information they’d gathered. These methods help businesses go beyond simple reports to discover why things happen and what might happen next.
Cloud computing changed who could access powerful analysis tools. Small companies and large corporations alike can now run sophisticated analyses without buying expensive hardware. This wider access to data intelligence and data analysis tools has increased competition across industries as more businesses base their decisions on solid information rather than gut feelings.

Understanding Big Data’s Role in Business Intelligence
A customer browsing products online, a factory sensor tracking production speeds, a social media comment about a new product – each interaction adds to an ever-growing pool of data. Yet many companies find themselves drowning in this sea of information, struggling to extract meaningful insights that could guide their decisions.
This surge in available data has spurred new approaches to business analysis and decision-making. While traditional reports and surveys still play their part, they tell only a fraction of the story. Business leaders now seek ways to harness information flowing from diverse sources – from sales terminals to social media feeds – and turn it into concrete actions that drive success.
Defining Big Data within the Business Context
Big data refers to complex, large-scale datasets that traditional processing tools struggle to manage. Volume, variety, and velocity are the hallmarks of big data, encompassing both structured and unstructured data. This includes text, images, videos, and sensor readings. Specialized tools and techniques are necessary to process, analyze, and extract valuable insights from big data.
Examples of big data in business abound, including customer purchase histories, website click data, social media posts, and sensor readings from factory machines. By analyzing these datasets, businesses can uncover hidden patterns, optimize operations, enhance customer experiences, and gain a competitive edge.
How Big Data Fuels Business Intelligence Strategies
Big data is the foundation upon which effective business intelligence strategies are built. It provides the raw material for informed decision-making and operational efficiency. Through customer data analysis, businesses gain valuable insights into preferences, purchasing habits, and pain points. This information enables them to craft better products and services that meet customer needs.
Predictive analytics powered by big data enables companies to forecast future trends and market shifts with remarkable accuracy. This foresight gives them a significant competitive advantage, allowing them to anticipate demand, optimize inventory, and proactively address potential issues. Furthermore, monitoring social media conversations and customer feedback helps businesses identify emerging trends and shifts in sentiment, enabling them to adjust their products and marketing strategies accordingly.
The Synergy between Big Data and Business Intelligence
Behind every major business decision lies a simple question: “What’s the best path forward?” In the past, answering this question meant relying on experience, market research, and educated guesses. But with vast amounts of business data now available for analysis, companies can approach this age-old question with unprecedented clarity.
The challenge isn’t just gathering information – it’s knowing how to interpret it meaningfully. Sales figures might show what customers bought yesterday, but understanding why they bought it, and what they might want tomorrow, requires deeper analysis. This need for better insights has sparked new methods of analyzing business data, from tracking key metrics to predicting future trends.
Enhancing Decision-Making through Data Insights
Converting data into actionable business decisions requires a carefully structured approach. At the foundation lies a clear hierarchy of metrics – from high-level strategic KPIs that guide company direction to granular operational measures tracking daily activities. For instance, a manufacturing plant might link its overall equipment effectiveness (OEE) score to specific measurements like machine downtime, production speed, and quality rates.
Successful organizations typically establish decision thresholds that trigger specific actions. When customer satisfaction scores drop below 85%, it might automatically initiate a review of recent support tickets. If inventory turnover rates exceed targets, purchasing algorithms adjust order quantities. These predefined response frameworks help teams act swiftly and consistently.
The physical presentation of data also shapes how effectively it influences decisions. Interactive dashboards allow users to drill down from summary statistics to supporting details, testing hypotheses and uncovering root causes. Color psychology plays a subtle but important role – using red for urgent alerts and green for positive trends taps into instinctive responses that speed up interpretation.
Cross-functional data access reveals previously hidden connections. When sales teams can see production schedules and inventory levels, they make more realistic promises to customers. When product designers can access repair records, they spot opportunities for durability improvements. This interconnected view turns departmental insights into organization-wide advantages.
Predictive Analytics: Forecasting Business Trends with Precision
Predictive analytics combines artificial intelligence with historical data from various sources to forecast future business conditions. Unlike traditional forecasting, these models analyze diverse data sets – from weather reports to social sentiment – creating sophisticated projections that drive strategic decisions. For example, manufacturers track market trends and supplier metrics to anticipate supply chain disruptions, while retailers analyze past sales patterns to optimize inventory across seasons.
Key applications in business processes include:
- Dynamic pricing – Adjusting product costs hourly based on demand signals and competitor moves
- Preventive maintenance – Using equipment sensor data to prevent costly factory shutdowns
- Risk modeling – Evaluating business opportunities through analysis of non-traditional indicators
- Product development – Testing new features against historical customer behavior patterns
The most effective systems focus on driving business growth through better decisions, providing clear confidence levels for each prediction while highlighting the key factors influencing outcomes. This balanced approach helps teams understand not just what might happen, but why – enabling more thoughtful responses to emerging opportunities and challenges.
Big Data in Action
Big Data is no longer just a buzzword – it’s a business imperative. As the volume, velocity, and variety of data continue to grow, organizations are turning to Big Data to drive innovation, improve efficiency, and uncover new opportunities. From predicting equipment failures to detecting fraudulent transactions, Big Data is being used to solve real-world problems and drive tangible results.
In the following case studies, we’ll explore how leading companies like Walmart, Netflix, and UPS are using Big Data to achieve their goals. Through their stories, we’ll see how Big Data is being applied to drive predictive maintenance, consumer insights, and fraud detection – and what insights can be gained for other industries and applications.
Walmart – Sales Performance
To stay ahead in the retail industry, Walmart integrates Big Data into its Business Intelligence platform to enhance sales analysis, customer insights, and supply chain optimization. Big Data sources, such as social media, sensor data, and IoT devices, are combined with traditional BI data to provide a comprehensive view.
- Big Data Integration: Walmart’s BI platform incorporates Big Data sources, enabling analysis of large datasets.
- Data Governance: Walmart establishes data governance policies to ensure data quality and security.
- Advanced Analytics: Big Data analytics and machine learning algorithms are applied to forecast sales, customer behavior, and supply chain disruptions.
Netflix – Subscriber Behavior
Netflix’s success relies on its ability to understand user preferences and behaviors. To achieve this, the company has developed a sophisticated Business Intelligence platform that harnesses the power of Big Data.
- Personalization: Big Data analytics enable Netflix to create personalized content recommendations, increasing user engagement and retention.
- Content Optimization: Data-driven insights help Netflix optimize its content portfolio, ensuring that users have access to relevant and appealing content.
- User Experience: Big Data analytics inform user experience improvements, making it easier for users to find and enjoy content.
UPS – Route Optimization
UPS is revolutionizing the logistics industry through its use of Big Data analytics. Integrating Big Data into its Business Intelligence platform provides UPS with real-time insights into operational performance, enabling data-driven decisions that optimize package delivery and fleet management.
- Operational Excellence: Big Data analytics identifies areas for improvement, streamlining operations and reducing costs.
- Fleet Optimization: Predictive maintenance and real-time monitoring ensure vehicles are running efficiently, reducing downtime and improving delivery times.
- Data-Driven Innovation: UPS uses Big Data insights to develop new services and solutions, staying ahead of the competition and meeting evolving customer needs.
Decision Foundry has over 20 years of experience helping enterprise customers build business intelligence platforms that turn big data into actionable insights.
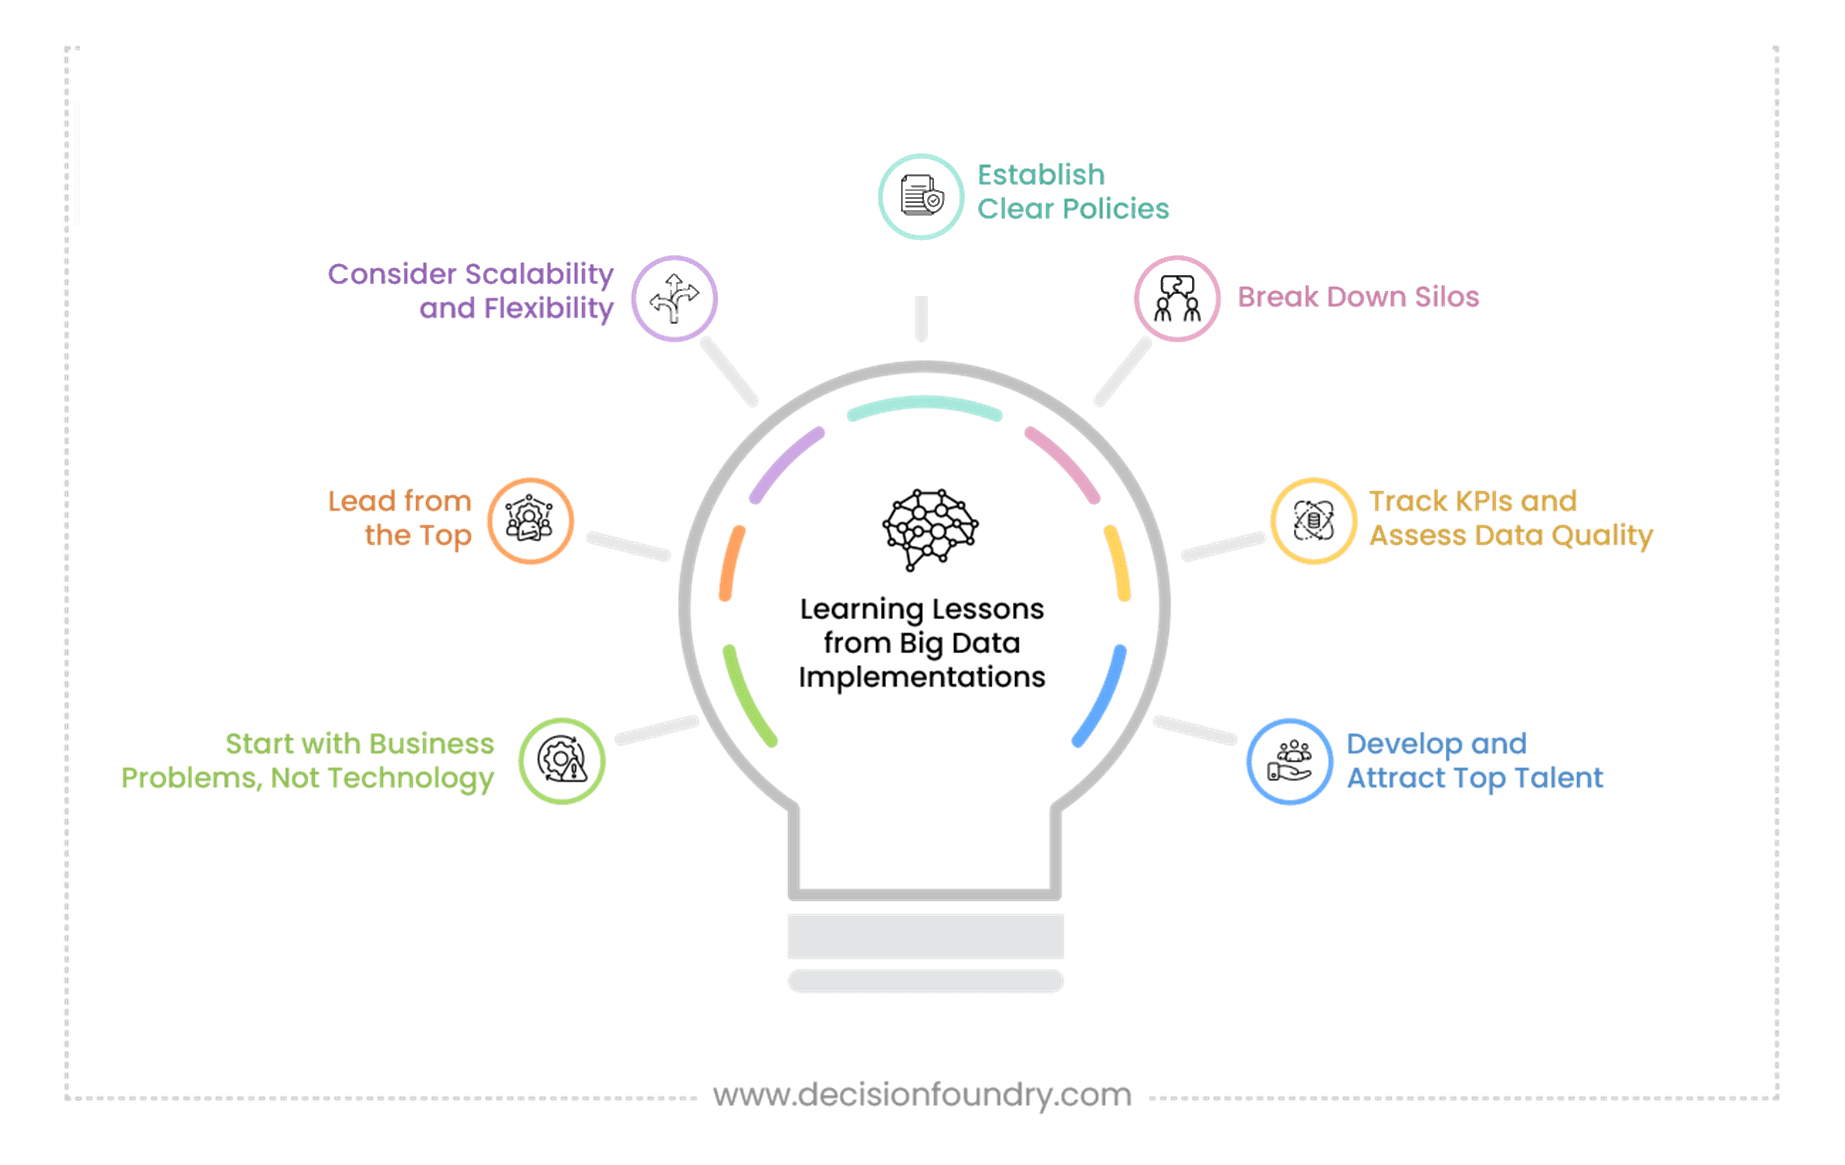
Learning Lessons from Big Data Implementations
Implementing Big Data solutions can be a complex and challenging process, but it also offers valuable opportunities for growth and learning. By examining the successes and setbacks of pioneering companies, we can distill key lessons and best practices for achieving Big Data success.
Start with Business Problems, Not Technology
- Identify specific business problems to solve, such as reducing customer churn or improving supply chain efficiency
- Determine the required data and analytics capabilities to address these problems
- Establish key performance indicators (KPIs) to measure success
Lead from the Top
- Encourage data literacy among all employees, not just technical teams
- Foster a culture of experimentation and learning
- Lead by example: have senior leaders champion data-driven decision-making
Consider Scalability and Flexibility
- Evaluate technologies based on scalability, flexibility, and integration capabilities
- Consider open-source options, cloud-based solutions, and hybrid approaches
- Ensure technology choices align with business objectives and data requirements
Establish Clear Policies
- Develop data management policies and procedures
- Ensure data accuracy, completeness, and consistency
- Implement data security measures, such as encryption and access controls
Break Down Silos
- Encourage cross-functional collaboration between technical and business teams
- Establish regular communication channels and feedback loops
- Ensure stakeholders understand the benefits and limitations of Big Data insights
Track KPIs and Assess Data Quality
- Regularly track KPIs and assess data quality
- Refine analytics models and adjust data strategies as needed
- Continuously monitor for data drift and concept drift
Develop and Attract Top Talent
- Identify skills gaps and develop training programs
- Attract and retain top data science and analytics professionals
- Encourage continuous learning and professional development
Technologies Powering Big Data and Business Intelligence
Let’s dive deeper into the technologies that make Big Data and Business Intelligence possible.
- Cloud Computing: Cloud computing offers a flexible and affordable way to store and handle large amounts of data. With cloud computing, you can easily scale up or down to meet changing business needs, without the hassle of managing physical infrastructure.
- Distributed Computing: Distributed computing allows for data analysis across multiple computers, making it possible to process large datasets quickly and efficiently. This technology is especially useful for complex data analysis tasks that require significant computational power.
- Data Visualization Tools: Data visualization tools turn complex data into interactive charts, graphs, and dashboards, making it easy to understand and act on insights. With data visualization, you can identify trends, spot patterns, and make data-driven decisions with confidence.

Cutting-Edge Tools for Data Analysis and Visualization
To take your data analysis and visualization to the next level, consider the following cutting-edge tools:
- Tableau, Power BI, and Qlik: These BI tools offer a range of features, including interactive dashboards, customizable reports, and data storytelling. With these tools, you can create stunning data visualizations that reveal hidden insights and drive business decisions.
- Python and R: These open-source programming languages provide powerful libraries and packages for data analysis, statistical modeling, and machine learning. With Python and R, you can create custom data solutions that meet your specific business needs.
The Rise of AI and Machine Learning in Data Processing
AI and machine learning are changing data processing and analysis. With machine learning algorithms, you can spot patterns, make predictions, and learn from new data without needing specific programming. These algorithms are especially useful for tasks like:
- Fraud detection
- Customer segmentation
- Personalized recommendations
But that’s not all! AI-based BI tools take it to the next level by using natural language processing (NLP) to enable users to interact with data in a more intuitive way. Imagine being able to ask questions, get answers, and explore data using everyday language – it’s like having a conversation with your data! With AI-based BI tools, you can:
- Ask questions and get instant answers
- Explore data using natural language queries
- Get insights and recommendations in plain language
This seamless interaction with data opens up new possibilities for business decision-making, and we’re just starting to scratch the surface of what’s possible!
Navigating the Challenges of Big Data Integration
As we dive into Big Data integration, several challenges arise. Key among them are:
- Data Silos: Data silos occur when data is fragmented across different systems and departments, making it hard to get a complete view of business operations.
- Data Quality, Consistency, and Accuracy: Data quality, consistency, and accuracy are crucial for reliable insights and decision-making.
- Data Privacy and Security: Data privacy and security are top concerns for businesses handling sensitive data.
The Role of IoT and Blockchain in Enhancing Data Collection and Analysis
IoT devices and blockchain technology are revolutionizing data collection and analysis. IoT devices with sensors and internet connectivity generate real-time data, enabling businesses to monitor operations, track customer behavior, and optimize resources. Blockchain technology provides a secure, transparent, and tamper-proof way to store and share data, ensuring data accuracy, integrity, and trust among stakeholders.
Building a Data-Driven Culture in Your Organization
To make the most of our data, we need to create a data-driven culture. This means educating employees on data analysis, providing training on data tools, and encouraging data-driven decision-making. We can also ensure data accessibility and demonstrate leadership commitment to data-driven decision-making.
- Employee training and education: We can educate employees on data analysis and provide training on data tools.
- Data accessibility: We can ensure data is easily accessible and encourage employees to explore data.
- Leadership commitment: We can demonstrate leadership commitment to data-driven decision-making and lead by example.
Best Practices for Data Governance and Ethics
Finally, let’s talk about data governance and ethics. We need to establish clear data governance policies and follow ethical guidelines to ensure responsible data use.
- Data ownership and responsibilities: We can define data ownership, roles, and responsibilities.
- Data quality standards: We can establish data quality standards and ensure data accuracy.
- Ethical guidelines: We can ensure data use is ethical, transparent, and respectful of privacy rights.
With these best practices, we can unlock the full potential of our data and make informed decisions to drive success!
The Road Ahead
And there you have it – the exciting world of Big Data and business intelligence! The synergy between Big Data and BI is transforming the way businesses approach decision-making, operational efficiency, and innovation. By embracing Big Data and BI, businesses can gain a formidable competitive edge, drive innovation, and achieve sustainable success.
The future of Big Data and business intelligence is bright, with emerging trends like AI-driven analytics, real-time data streaming, and IoT and edge computing revolutionizing the way we approach data analysis. As we continue to push the boundaries of what’s possible with Big Data and BI, let’s remember to stay focused on the end goal: making informed decisions, driving business success, and creating a better future for all.
Keep exploring, learning, and pushing the boundaries of what’s possible with Big Data and business intelligence. The power of Big Data and BI drives business success, fuels innovation, and creates a brighter future for all. The journey ahead is exciting, and the potential for innovation and growth is limitless – let’s make the most of it!
Frequently Asked Questions
How Can Small Businesses Leverage Big Data for BI?
Even small businesses can use big data for business intelligence. This helps them gain a competitive edge. By using affordable cloud-based BI tools, they can collect and analyze data that fits their specific needs. This way, small businesses can find valuable insights. These insights can help improve customer experience, make their operations better, and support data-driven decisions.
What Are the Common Pitfalls in Implementing Big Data Projects?
Common problems in big data projects include poor planning, unclear goals, ignoring data quality, not having enough skilled workers, and underestimating what the infrastructure needs. To tackle these issues, you need a clear plan, realistic goals, and a focus on operational efficiency and making decisions based on data.
How Does Big Data Integration Impact Customer Experience?
Big data integration helps improve the customer experience. It offers valuable insights about customer needs and behaviors. Businesses can use this data to make interactions more personal. They can also predict what customers like and solve problems before they arise. This leads to higher customer satisfaction and stronger relationships.
What Skills are Needed for a Career in Big Data and BI?
A job in big data and business intelligence needs both technical and analytical skills. Data scientists, data engineers, and BI analysts should have strong analytical skills. They also need to know programming languages like Python or R. A good understanding of data warehousing and data visualization tools is important.


