Key Highlights
- Business analytics tools are essential for organizations to stay ahead.
- These tools provide insights from data, enabling businesses to make informed decisions, optimize processes, and identify growth opportunities.
- From descriptive analytics to prescriptive analytics, businesses can utilize different types of tools to gain a comprehensive view of their operations.
- Key features to consider when selecting business analytics tools include real-time data processing, advanced visualization capabilities, and AI and machine learning integration.
Data + Insight
Where data meets insight, opportunity awaits. The art of business analytics is transforming the way companies operate, creating a new era of innovation, efficiency, and profitability.
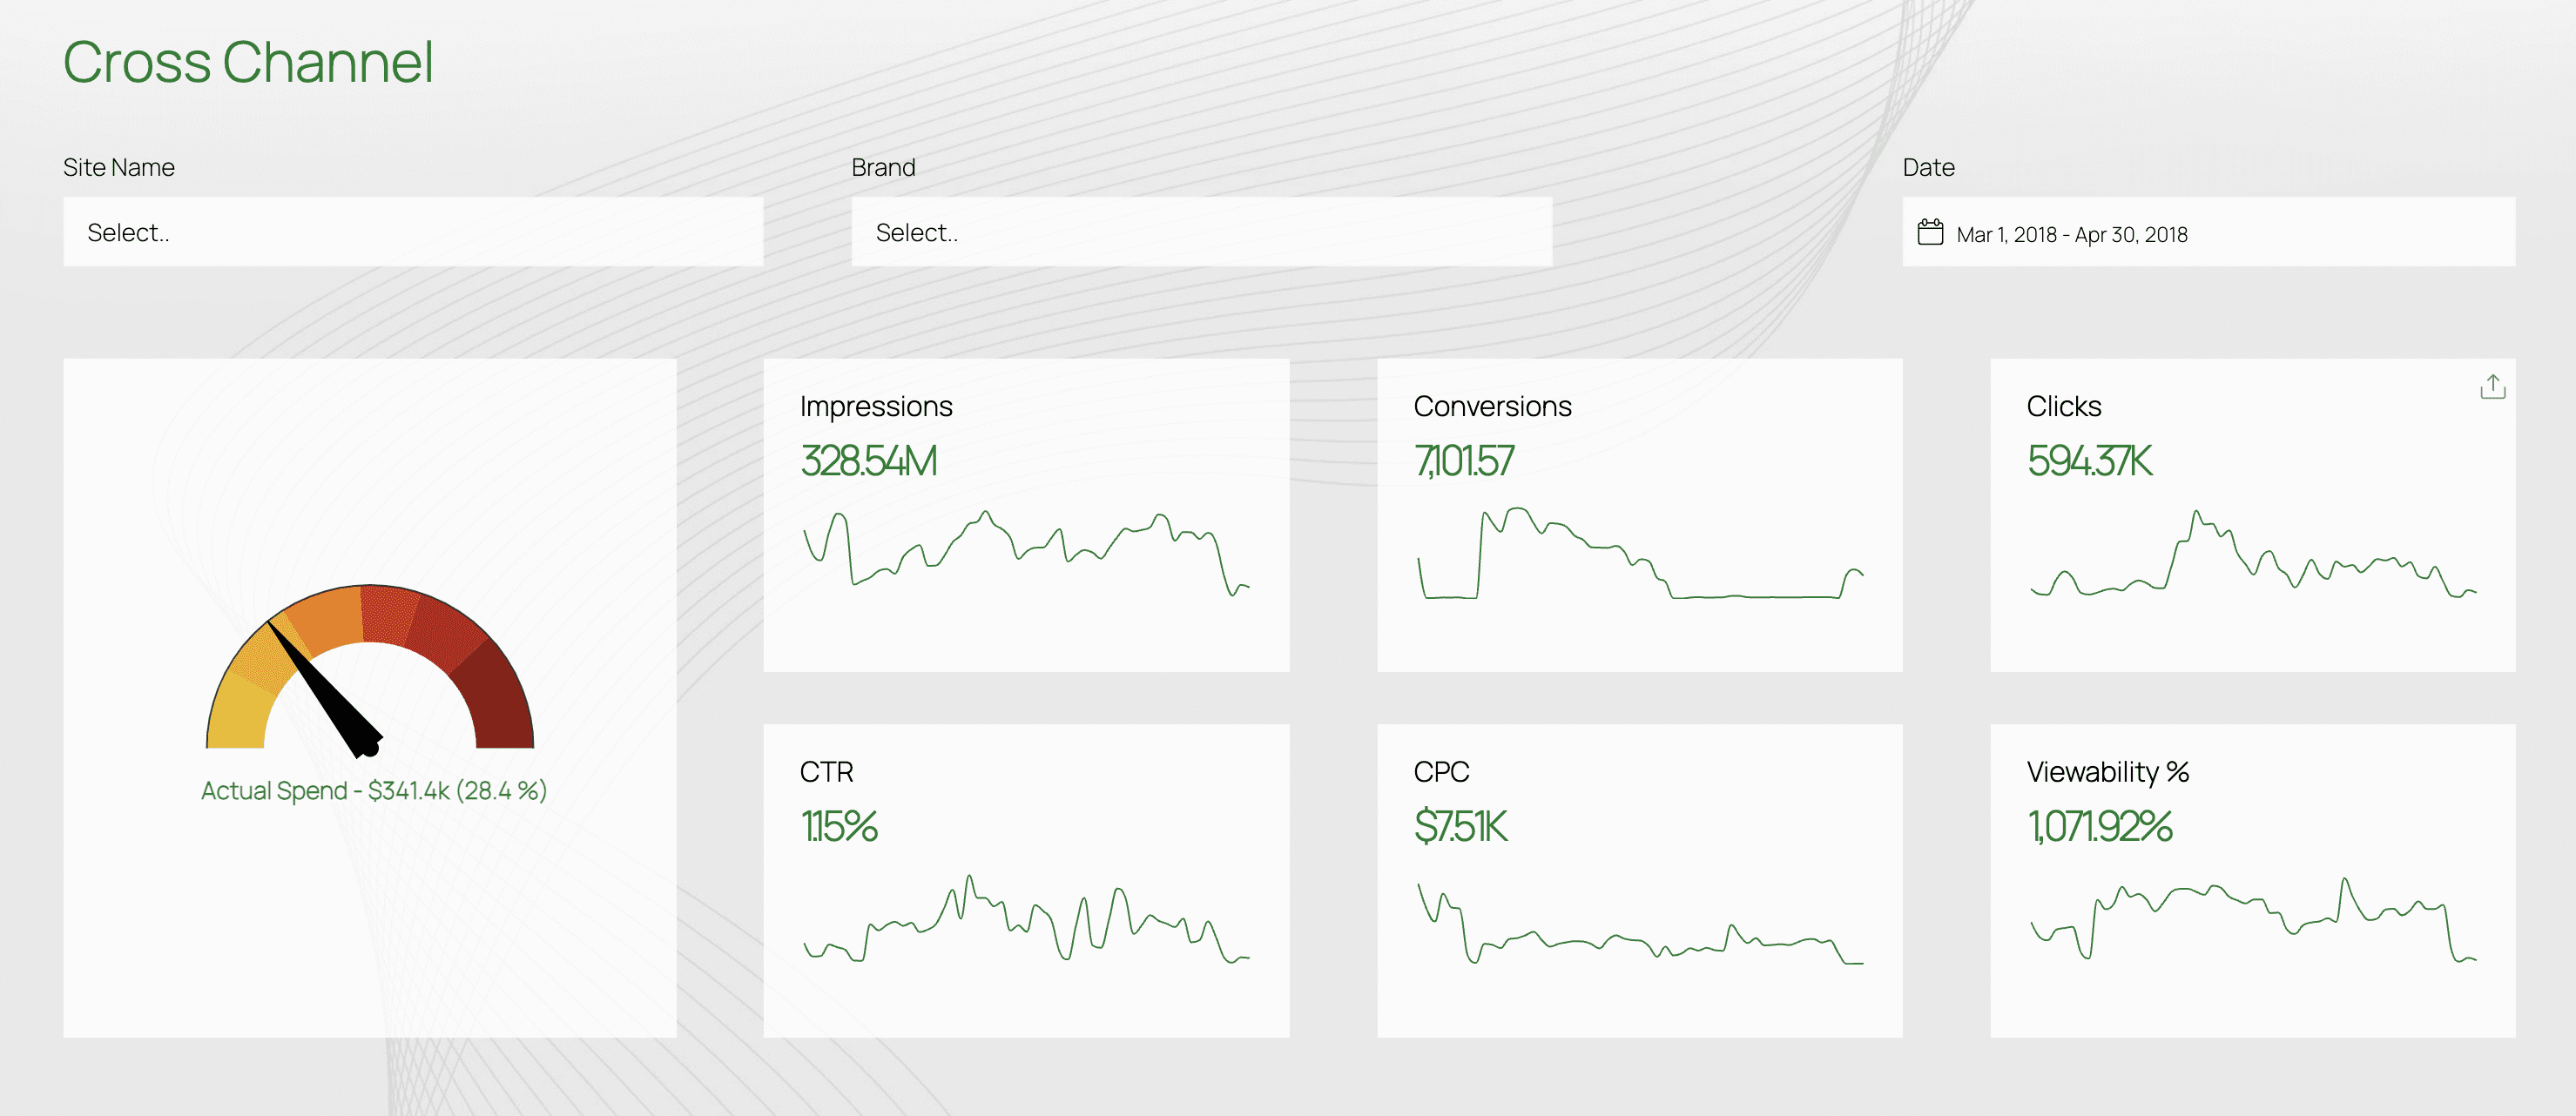
In this landscape, real-time data processing, advanced visualization, AI and machine learning, and predictive analytics are revolutionizing business operations, customer engagement, and strategic decision-making. Uncovering hidden patterns, predicting future trends, and informing decision-making, business analytics tools are reshaping the way organizations compete and succeed.
Key Features to Look for in Business Analytics Tools
Selecting the right business analytics tool requires careful consideration of several key factors. Usability is paramount, as an intuitive tool enables both experts and non-experts to easily analyze data, generate reports, and uncover insights from different sources. Seamless integration with existing systems ensures smooth data flow and minimizes manual data entry.
Real-time data handling is increasingly crucial for agile businesses, particularly for new users. Features like real-time dashboards and alerts provide instant insights, enabling swift responses to market shifts and customer needs. Furthermore, a robust business analytics tool must prioritize security, safeguarding sensitive data and ensuring compliance with critical regulations.
1. Real-time Data Processing
The pace of business has officially gone into hyperdrive, and real-time data processing is the turbocharger that’s making it all possible. With the ability to access accurate and actionable insights at the speed of light, companies can now respond to changing market conditions, customer behaviors, and emerging trends with unprecedented agility.
Gone are the days of waiting for batch-processed data or relying on static reports that are obsolete the moment they’re printed. Now, businesses can tap into the power of real-time data to make informed decisions, capitalize on new opportunities, and leave the competition in the dust.
So, what’s driving this revolution? Real-time data processing is the secret sauce, and it’s made possible by a range of cutting-edge technologies that enable:
- Real-time monitoring of key performance indicators and trends through interactive dashboards
- High-volume data stream processing to extract valuable insights in real-time
- Rapid data processing and analysis through in-memory databases
- Interactive and dynamic data visualization to bring insights to life
2. Advanced Visualization Capabilities
Data visualization has evolved from a nice-to-have to a must-have in modern business analytics tools. Complex data, including historical data, is transformed into interactive charts, graphs, and maps, making it easier to uncover hidden patterns, identify trends, and share insights. As big data analytics continues to explode, data visualization tools are indispensable for taming large data sets and extracting valuable insights.
One of the most significant benefits of data visualization is its ability to narrate a story using data. For instance, mapping the customer journey reveals customer behavior at each touchpoint, pinpoints areas for improvement, and elevates the overall customer experience. Data visualization also tracks the effectiveness of marketing campaigns, monitors supply chain efficiency, and detects potential risks in real-time.
Effective data visualization is more than just aesthetically pleasing charts; it’s about selecting the right visualization methods to reveal critical insights. Color and design focus attention on key findings, while clear presentation facilitates understanding and informs smart decision-making. Data visualization unlocks the full potential of data, transforming raw numbers into actionable knowledge.
3. AI and Machine Learning Integration
The rise of AI and machine learning has redefined the business analytics landscape. These technologies automate intricate data processes, unearth hidden patterns, and fuel predictive insights. As data complexity intensifies, AI and machine learning emerge as indispensable allies for businesses seeking to harness the power of their data.
A key benefit of AI and machine learning lies in their ability to decode complex data relationships. Predictive modeling, for instance, exposes customer attrition risks, sales performance drivers, and equipment failure precursors. Additionally, AI and machine learning optimize marketing strategies, refine supply chain operations, and detect potential risks in real-time.
To fully capitalize businesses must move beyond mere automation. They need to strategically apply these technologies to unlock critical insights, using techniques like decision trees and clustering to reveal hidden data narratives. By doing so, businesses can transform raw data into actionable wisdom, driving informed decision-making and competitive advantage.
Top 7 Business Analytics Tools
With a plethora of options available, selecting the right tool can be a daunting task. To simplify this process, we’ve compiled a list of the top 7 business analytics tools that are making waves in the industry. From data visualization to predictive analytics and statistical functions, these tools offer a range of capabilities to help businesses make informed decisions, drive growth, and stay ahead of the competition. Let’s dive into the features, benefits, and use cases of each tool, and explore how they can help businesses thrive in a rapidly changing environment.
- Tableau
- Key features: Data visualization, interactive dashboards, real-time analytics
- Use cases: Sales performance analysis, customer behavior tracking, market trend identification
- Have Tableau Questions? We got answers.
- Power BI
- Key features: Business intelligence, data modeling, predictive analytics
- Use cases: Financial reporting, operational performance monitoring, supply chain optimization
- Get the Most Out of Power BI – Ask Our Experts.
- SAS Analytics
- Key features: Advanced analytics, machine learning, data mining
- Use cases: Risk management, customer segmentation, predictive maintenance
- Google Analytics
- Key features: Web analytics, audience insights, conversion tracking
- Use cases: Website optimization, digital marketing performance measurement, user behavior analysis
- QlikView
- Key features: Business intelligence, data discovery, associative analytics
- Use cases: Sales forecasting, customer relationship management, operational efficiency improvement
- IBM Cognos Analytics
- Key features: Business intelligence, predictive analytics, AI-driven insights
- Use cases: Financial planning, operational performance management, strategic decision-making
- Domo
- Key features: Business cloud, real-time analytics, data integration
- Use cases: Sales performance management, customer success tracking, operational efficiency monitoring
How Business Analytics Tools Drive Decision-Making
Gone are the times when businesses made decisions just by following their gut. Now, business data, including aggregate data, is very important. Business analytics tools help change raw data into actionable key insights that optimize and support smart decision-making in business processes. These tools can look at past trends, guess future results, and alert decision makers to unforeseen events while suggesting the best actions. They help businesses make informed business decisions based on data that can boost efficiency, cut costs, and raise profits.
Business analytics tools and BI tools are changing the way smarter decisions are made in all parts of a company, specifically regarding business operations. They can improve marketing efforts, customize customer experiences, and make supply chain management processes easier. By giving a strong, data-based basis for decisions, these tools allow businesses to stop relying on guesses and feelings. This helps them make better and more informed choices that improve results.
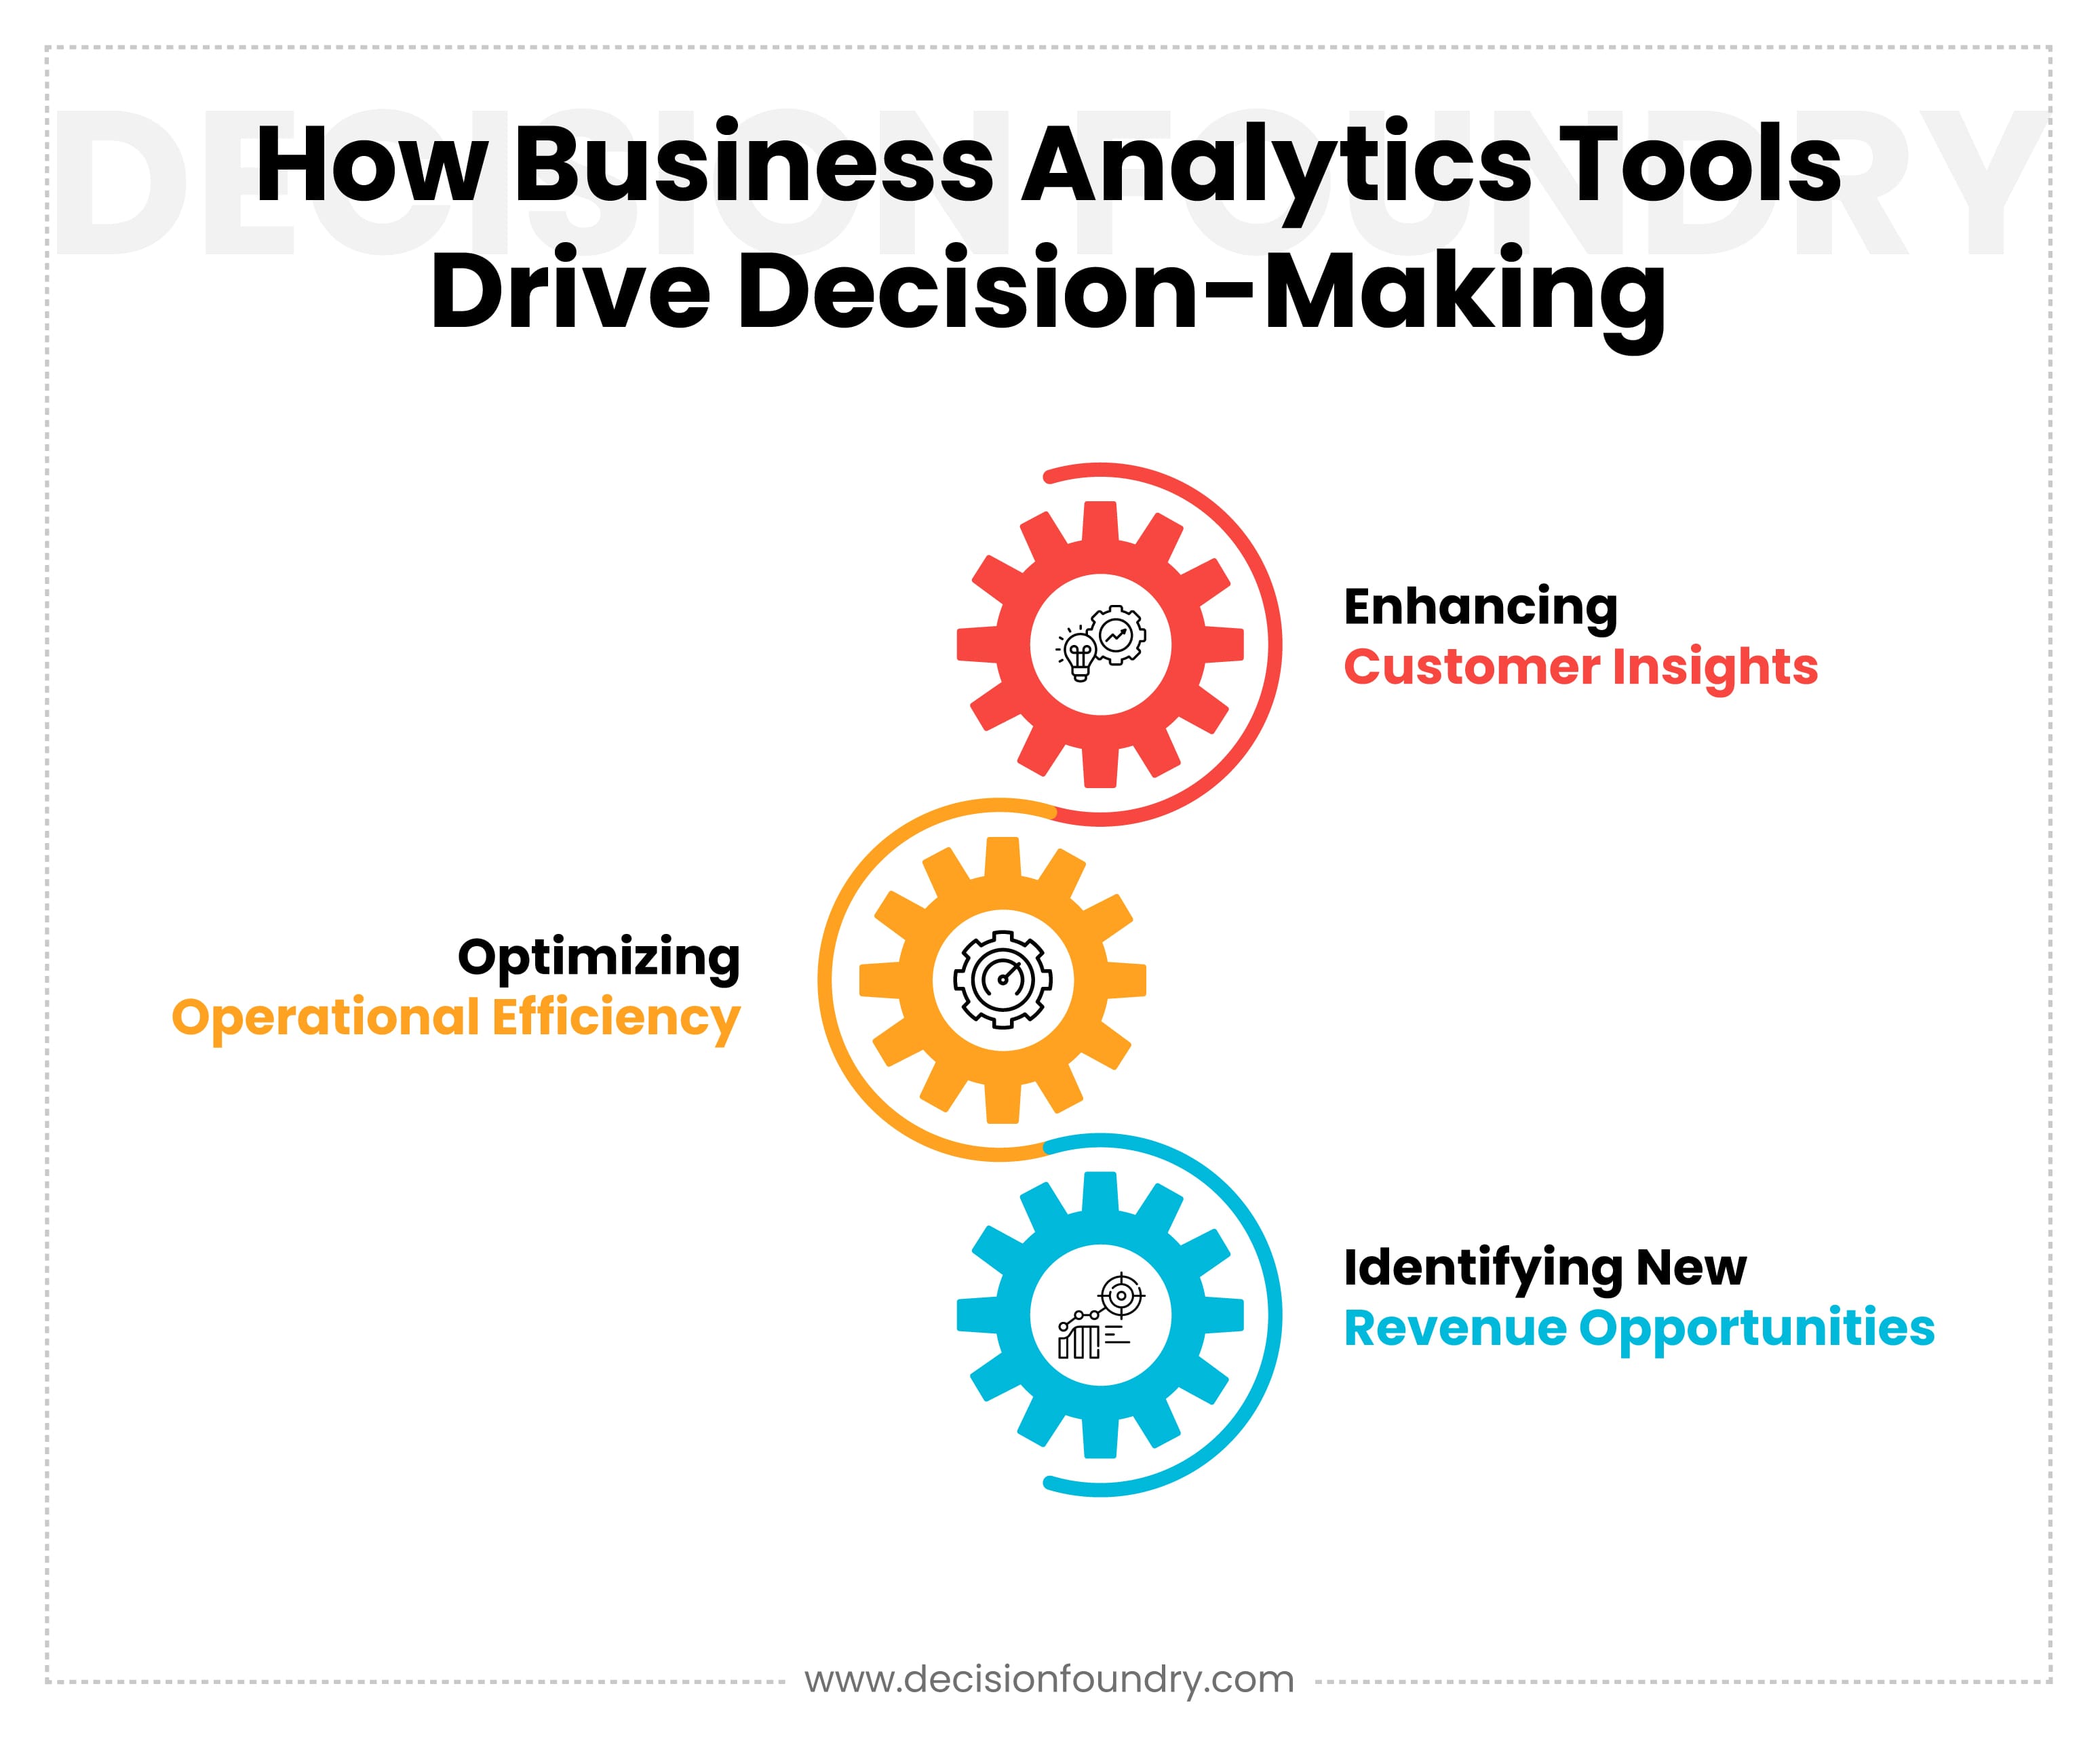
Enhancing Customer Insights
Unraveling the mystery of customer behavior is a puzzle worth solving – and business analytics tools like Google Analytics are the missing piece. They reveal the intricacies of customer decision-making, shedding light on the whys behind buying behavior, and helping businesses understand what drives customer loyalty and retention. Consumer insights can be incredibly broad, such as understanding demographic trends, or very specific, like identifying pain points in the customer journey. They are derived from a mix of market research, customer feedback, and data science, and can be used to inform marketing strategies, product development, and customer experience initiatives.
Business analytics tools take customer insights to new heights by applying advanced analytics capabilities to customer data. These tools:
- Apply machine learning algorithms to identify complex patterns in customer behavior, preferences, and needs, revealing new insights that inform targeted marketing and service initiatives.
- Utilize natural language processing (NLP) to analyze customer feedback, sentiment, and opinions across social media, reviews, and support channels, providing a comprehensive view of customer sentiment.
- Create detailed customer journey maps, highlighting pain points, opportunities for improvement, and moments of delight, enabling businesses to optimize the customer experience.
- Segment and cluster customers using advanced statistical models, revealing nuanced insights into behavior, motivation, and preferences, and enabling targeted marketing and service initiatives.
- Analyze customer interactions across touchpoints, including web, mobile, and physical channels, providing a comprehensive view of customer behavior and preferences.
Optimizing Operational Efficiency
When resources are scarce and competition is fierce, operational efficiency is key. This critical component refers to the optimal use of resources, such as time, money, and talent, to achieve maximum productivity and profitability. Successful businesses are built on a foundation of streamlined processes, eliminated waste, and continuously improved workflows. In this state, companies can reduce costs, enhance customer satisfaction, and gain a competitive edge. Business analytics tools play a vital role in uncovering workflow intricacies, identifying areas for improvement, and informing data-driven decisions that drive operational excellence and overall business success.
Ways Business Analytics Tools Optimize Operational Efficiency
- Analyze Process Performance: Examine end-to-end processes to identify inefficiencies, bottlenecks, and areas for improvement.
- Monitor Key Performance Indicators (KPIs): Track and analyze KPIs to measure operational performance, identify trends, and make data-driven decisions.
- Optimize Resource Allocation: Use analytics to allocate resources more effectively, reducing waste and improving productivity.
- Streamline Operations: Identify opportunities to simplify and streamline processes, reducing complexity and improving efficiency.
- Inform Strategic Decision-Making: Provide actionable insights to inform strategic decisions, drive business growth, and improve competitiveness.

Identifying New Revenue Opportunities
Stagnant growth and declining revenues can often be traced back to a failure to adapt and innovate. In contrast, businesses that consistently identify and pursue new revenue opportunities are better positioned to stay ahead of the competition, drive innovation, and achieve sustainable growth. Advanced analytics and strategic insights play a crucial role in helping companies gain a deeper understanding of their customers, markets, and competitors, and uncover new avenues for revenue expansion. Effective identification of new revenue opportunities is critical to driving business success and achieving long-term prosperity. Some effective ways to identify new revenue opportunities are:
- Market Trend Analysis: Emerging trends, shifts in demand, and untapped markets are uncovered through predictive analytics, revealing new opportunities for growth.
- Customer Segmentation: Hidden customer segments are unearthed, their preferences decoded, and offerings tailored to meet their unique needs, driving new revenue streams.
- Competitor Intelligence: Market gaps and opportunities for differentiation are exposed by dissecting competitors’ strategies, enabling businesses to capitalize on untapped markets.
- Product/Service Optimization: Revenue potential is maximized by evaluating and refining offerings, optimizing pricing strategies, and identifying opportunities for innovation.
- Geographic Expansion Analysis: High-potential markets are pinpointed, their attractiveness assessed, and targeted marketing strategies informed, driving expansion and new revenue growth.
Decision Foundry has over 20 years of experience helping enterprise customers implement business intelligence platforms like Tableau and Power BI at enterprise scale.
The Role of AI and Machine Learning in Business Analytics
The integration of artificial intelligence (AI) and machine learning (ML) into business analytics marks a significant shift in the way organizations approach data-driven decision-making. These technologies automate complex analysis, uncover hidden patterns, and generate predictive models, enabling businesses to make informed, strategic choices.
AI and ML are redefining customer engagement through personalized marketing campaigns and empathetic chatbots. Organizations can now forecast future trends and outcomes with greater accuracy, supporting proactive decision-making and driving business growth and competitiveness. As AI and ML continue to evolve, their impact on business analytics and operations will only intensify, revolutionizing the way organizations approach data, customers, and strategy.
Predictive Analytics for Forecasting Trends
Predictive analytics is a powerful tool that helps businesses forecast future trends and outcomes with remarkable accuracy by incorporating best practices. It does this by analyzing historical data, identifying patterns and trends, and using machine learning algorithms to make informed predictions. With predictive analytics, businesses can forecast customer demand, anticipate market shifts, and predict revenue growth, enabling them to optimize inventory, pricing, and resource allocation, stay ahead of the competition, and make informed decisions about investments.
Artificial intelligence (AI) and machine learning (ML) are revolutionizing predictive analytics, enabling businesses to forecast trends with unparalleled accuracy. AI and ML algorithms can:
- Analyze vast amounts of data: Quickly process and analyze large datasets, identifying patterns and relationships that would be impossible for humans to detect.
- Uncover complex relationships: Identify complex relationships between variables, enabling businesses to forecast trends and outcomes with greater accuracy.
- Continuously learn and adapt: Learn from new data and improve predictions over time, ensuring businesses stay ahead of the curve and make informed decisions
Natural Language Processing for Data Interpretation
Natural Language Processing (NLP) is a groundbreaking field that brings human language and computer systems closer together through programming languages. Sophisticated algorithms and statistical models enable computers to process, understand, and generate natural language data with remarkable accuracy. This technology has transformed Business Analytics, allowing organizations to tap into the wealth of insights hidden within unstructured data.
NLP’s computational models grasp the intricacies of human language, from syntax and semantics to context and pragmatics. Text data analysis reveals patterns, relationships, and trends that would elude human detection. Businesses gain a deeper understanding of their customers, markets, and competitors, driving informed decision-making and strategic growth. As NLP continues to evolve, its applications in Business Analytics will only continue to expand, opening up new avenues for innovation and success.
NLP is currently being used in various ways to support business analytics, including:
- Market Intelligence: Extracting insights from news articles, research reports, and social media to identify market trends, competitors, and emerging opportunities.
- Entity Recognition: Identifying and extracting specific information, such as names, locations, and organizations, from unstructured text data to support business intelligence and analytics.
- Text Classification: Automating the categorization of text data, such as documents and reports, to streamline business processes and improve efficiency in data analysis.
- Sentiment Analysis: Analyzing customer feedback and reviews to understand opinions and emotions, enabling businesses to identify areas for improvement and measure customer satisfaction.
- Topic Modeling: Identifying underlying themes and topics in large volumes of text data to support business analytics and strategic decision-making.
Very Informed, Very Innovative
The era of data-driven business has arrived, and with it, a new set of opportunities and challenges.
We’re living in a time where data is the driving force behind business success, but it’s easy to get left behind. With the pace of innovation accelerating, it’s hard to keep up.
Business analytics tools and technologies help organizations capitalize on new revenue streams, optimize operations, and drive growth.
Data-driven insights reveal new opportunities, improve efficiency, and drive innovation, giving businesses a competitive edge.
The right business analytics tool amplifies your insights and accelerates your journey. Take the first step towards transforming your business with data-driven insights and achieving unprecedented success!
Frequently Asked Questions
What Makes a Business Analytics Tool Stand Out?
A business analytics tool stands out by providing a great user experience. It connects easily to various data sources. It also has special features designed for different industries. This helps users turn data into actionable insights.
How Do Business Analytics Tools Integrate with Existing Systems?
Business analytics tools work well with current systems using strong APIs, connectors, and data integration features. This setup helps move information easily from different technology systems. It makes business analysis and data management much easier.
Can Small Businesses Benefit from Advanced Business Analytics Tools?
Advanced business analytics tools help small businesses use business intelligence. This allows them to make smart strategic decisions. They can also optimize how they allocate resources. With these tools, small businesses can compete better and grow in a sustainable way.
How to Measure the ROI of Business Analytics Tools?
To measure the ROI of business analytics tools, use quantitative methods. These methods help you see how these tools affect important business goals. This includes better financial performance, higher customer satisfaction, and better operational efficiency.


