The Role of BA and BI
Data is everywhere. It’s in every click, purchase, and social media interaction. From customer behavior to operational metrics, this constant stream of information holds untapped potential – but its true worth emerges only when shaped into actionable insights. Business Analytics (BA) and Business Intelligence (BI) are two distinct yet complementary disciplines that help organizations harness the power of data.
Consequently, the effective utilization of BA and BI has become increasingly crucial for businesses seeking to gain a competitive edge. With businesses generating vast amounts of data, the ability to effectively analyze and interpret this information can make the difference between success and failure. BA and BI offer unique paths to navigating the complex landscape of data, providing decision-makers with the tools they need to ask the right questions, uncover hidden patterns, and make informed choices.
The volume and complexity of data continue to grow, making the role of BA and BI in shaping organizational success increasingly vital. Insights gleaned from these disciplines enable businesses to adapt quickly to changing market conditions, anticipate future trends, and make data-driven decisions that drive innovation and growth. Teams that effectively leverage BA and BI gain a significant advantage in an era where data is the new currency, positioning themselves for success in an ever-evolving digital landscape.
Diving Deep into Business Intelligence
The need for precise, data-driven insights has never been more critical. Business intelligence answers this need by offering a clear window into operations, performance, and market dynamics. BI excels at revealing the current state of affairs – cutting through complexity to show exactly where a business stands at any given moment.
The field of business intelligence has undergone dramatic changes since its inception. What started as basic reporting has grown into a sophisticated ecosystem of tools and methodologies that serve everyone from C-suite executives to front-line managers. Understanding this evolution and the BI toolkit proves essential for organizations aiming to compete in the current data-rich environment.
The Evolution and Definition of Business Intelligence
Business intelligence has evolved from simple data reporting to a sophisticated system of tools and methodologies that provide clear visibility into business operations. While early BI focused primarily on historical data analysis, BI combines real-time monitoring, interactive dashboards, and automated reporting to deliver immediate, actionable insights.
BI serves as an operational compass, offering a detailed view of current performance across multiple dimensions. Unlike business analytics’ future-focused approach, BI helps with answering critical questions about present operations: Which products drive the most profit? Where do bottlenecks occur in our processes? How do different regions compare in sales performance?
Key elements of modern BI include:
- Data Warehousing: Centralized repositories collect and organize data from various sources, creating a single source of truth for business reporting and analysis. This foundation ensures consistency and reliability in decision-making across departments.
- Real-Time Processing: BI tools process data as it arrives, enabling immediate responses to changing business conditions. This capability proves particularly valuable in fast-moving industries where quick decisions can mean the difference between success and failure.
- Self-Service Analytics: BI platforms help non-technical users to explore data and create custom reports without relying on IT departments. This democratization of data analysis speeds up decision-making and promotes a data-driven culture throughout organizations.

Business Intelligence Tools: Transforming Data into Insights
The BI toolkit comprises various specialized applications and platforms, each serving distinct analytical needs. These tools work together to create a comprehensive view of business operations, turning complex data into clear, actionable insights.
Essential BI tools include:
- Interactive Dashboards: Dashboards present key performance indicators (KPIs) in real-time, allowing users to drill down into specific metrics and explore underlying data. These visual interfaces make complex information accessible and help identify trends or issues that require attention.
- Reporting Platforms: Automated reporting tools generate regular updates on business performance, distributing tailored information to different stakeholders. These platforms support everything from daily operational reports to comprehensive monthly analytics, ensuring everyone has the information they need.
- Data Visualization Tools: Advanced visualization capabilities transform raw numbers into compelling visual stories. Through charts, graphs, and interactive displays, these tools help users quickly grasp complex relationships and patterns within their data.
For teams implementing BI, success depends on choosing the right combination of tools and ensuring proper integration with existing systems. Start by assessing specific reporting needs and user technical capabilities. Consider factors like data volume, update frequency, and required analysis depth. Most importantly, focus on tools that deliver actionable insights aligned with business objectives rather than just impressive visualizations.
Exploring the Core of Business Analytics
Business analytics marries mathematics, statistics, and specialized software to uncover meaningful patterns within vast datasets. Understanding both the fundamentals and practical applications of BA proves essential. This section breaks down these core elements and shows how they work together to drive better business outcomes.
Defining Business Analytics
A subset of Business Intelligence, Business Analytics (BA) involves using data to predict future trends, opportunities, and challenges. At its foundation lies a powerful combination of statistical analysis, data mining techniques, and advanced modeling – all working together to extract valuable insights from complex datasets.
Key components of business analytics include:
- Analytical Frameworks: BA operates through three distinct but interconnected approaches: descriptive analytics examines past performance patterns, predictive analytics forecasts future trends using statistical models, and prescriptive analytics recommends specific actions based on these insights.
- Data Processing Methods: The journey from raw data to actionable insights involves multiple specialized techniques. Data mining uncovers hidden patterns and relationships, while statistical modeling helps validate findings and measure their significance. Advanced visualization tools then transform complex findings into clear, understandable formats that guide decision-making.
- Technical Foundation: Successful BA implementation requires mastery of several core competencies. These include statistical analysis skills, programming knowledge (particularly in languages like Python or R), database management expertise, and proficiency with specialized BA software tools. For newcomers to the field, focusing on one area at a time helps build a solid technical foundation.

Applying Business Analytics to Drive Success
BA’s power lies in its practical application to business challenges. When properly implemented, analytics transforms data into a strategic asset that drives competitive advantage and operational excellence.
Real-world applications of BA include:
- Strategic Planning: Organizations use predictive models to anticipate market changes and identify emerging opportunities. These insights help shape long-term strategy and resource allocation, keeping companies ahead of industry trends rather than merely reacting to them.
- Operational Optimization: BA tools analyze process efficiency across departments. From supply chain management to customer service, these insights highlight bottlenecks, predict maintenance needs, and suggest improvements that reduce costs while enhancing performance.
- Customer Intelligence: Advanced analytics helps decode customer behavior patterns, preferences, and future needs. This deep understanding enables personalized marketing approaches, product development decisions, and service improvements that drive customer satisfaction and loyalty.
For companies implementing BA, success depends on clear problem definition and methodical execution. Start by identifying specific business challenges that analytics could address. Then assess available data sources, choose appropriate analytical methods, and establish clear metrics for measuring success. This structured approach ensures that analytical insights translate into meaningful business improvements.
Business Analytics and Business Intelligence
Every successful business strategy starts with understanding – understanding where you’ve been, where you are, and where you’re headed. BA and BI each illuminate different parts of this journey, working together to create a complete picture of business performance. Like two sides of the same coin, these disciplines complement each other in ways that amplify their individual strengths and provide leaders with deeper, more actionable insights.
BA and BI diverge most notably in their temporal focus. BI acts as your organization’s mirror, reflecting current realities through careful analysis of historical and real-time data. It excels at answering questions about present performance and recent trends, helping teams understand the immediate impact of their decisions. BA, meanwhile, serves as your telescope – using sophisticated modeling techniques to peer into possible futures and guide strategic planning. It specializes in not just predicting what might happen, but recommending specific actions to shape favorable outcomes.
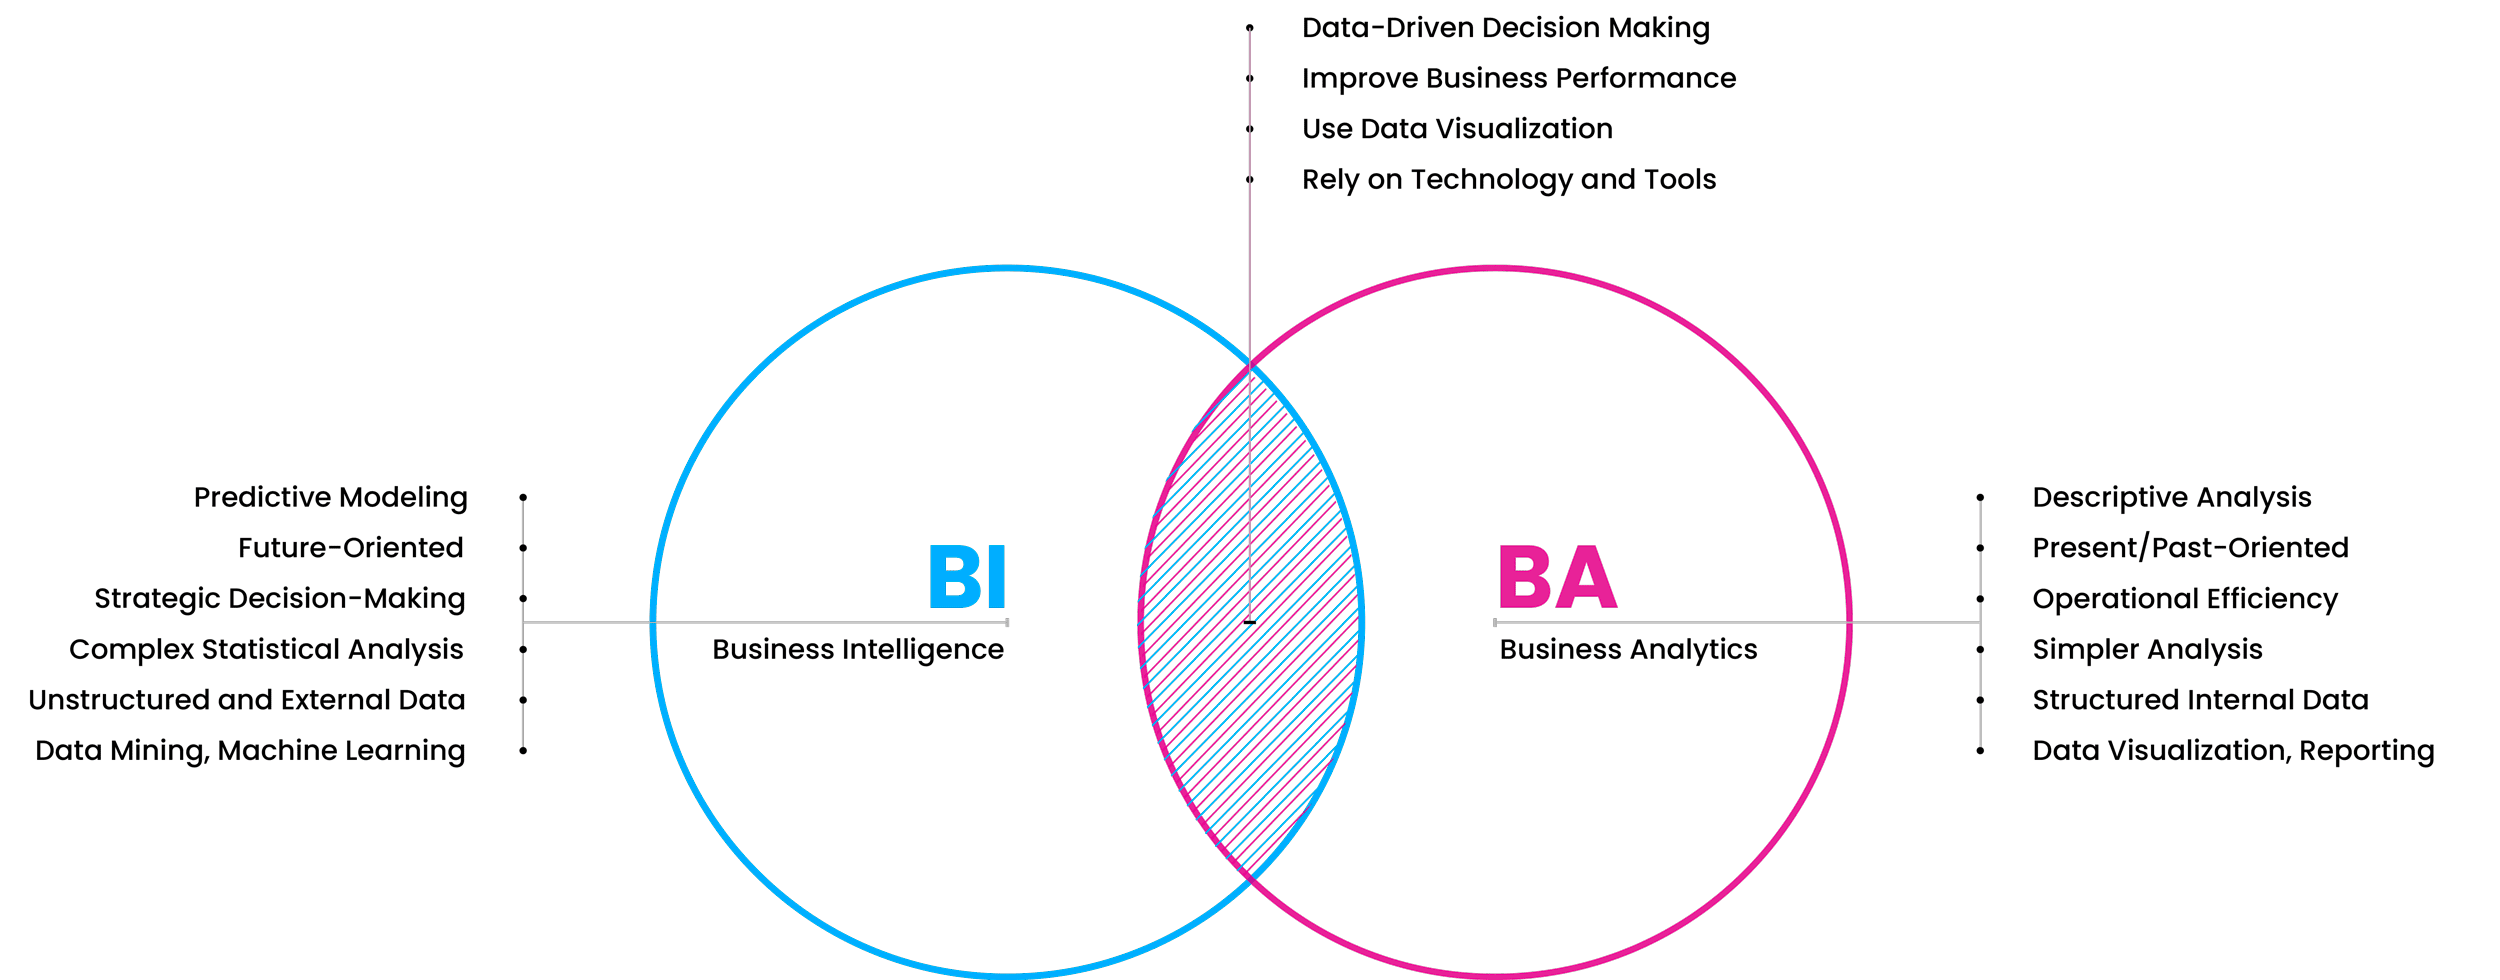
Business Analytics (BA):
- Predictive Modeling
- Future-Oriented
- Strategic Decision-Making
- Complex Statistical Analysis
- Unstructured and External Data
- Data Mining, Machine Learning
Business Intelligence (BI):
- Descriptive Analysis
- Present/Past-Oriented
- Operational Efficiency
- Simpler Analysis
- Structured Internal Data
- Data Visualization, Reporting
Overlap (Both BA and BI):
- Data-Driven Decision Making
- Improve Business Performance
- Use Data Visualization
- Rely on Technology and Tools
Key Differences and Similarities
While both business analytics (BA) and business intelligence (BI) are integral to data-driven decision-making, they have distinct focuses and approaches.
Business Intelligence (BI):
- Primary Focus: Understanding current operations by analyzing historical and real-time data.
- Key Objectives:
- Monitor and track key performance indicators (KPIs)
- Identify operational trends and patterns
- Facilitate informed tactical decisions
- Data Sources: Primarily structured data from internal systems (e.g., sales, finance, inventory).
- Tools and Techniques:
- Data visualization (dashboards, reports, charts)
- Ad-hoc queries and standard reports
- OLAP (online analytical processing)
Business Analytics (BA):
- Primary Focus: Predicting future outcomes and guiding strategic decisions.
- Key Objectives:
- Uncover deeper insights and hidden patterns in data
- Forecast future trends and behaviors
- Optimize processes and strategies
- Data Sources: Both structured and unstructured data from internal and external sources.
- Tools and Techniques:
- Statistical analysis
- Data mining
- Machine learning and predictive modeling
Implementing Business Intelligence in Your Business
Business intelligence (BI) implementation requires careful planning to solve real business problems using data analysis. When done well, BI helps organizations process large amounts of data to generate useful insights for decisions at every level.
Key Implementation Components:
- Strategic Planning: Create a business intelligence strategy that aligns with your objectives. This involves understanding what business users in each department need, setting measurable targets, and establishing data management policies that maintain information quality and security. Business analysts play a key role in defining these requirements and best practices.
- Team Development: Build an analytics team that includes data analysts and data scientists who can handle complex business analysis needs. Your team should excel not only in using analytical tools but also in communicating findings to decision-makers who may not have technical backgrounds.
- Technical Infrastructure: Set up a centralized system for collecting and storing big data from various business systems. This foundation ensures everyone from analysts to executives works with consistent, reliable information when making decisions.
- Tool Selection: Choose business analytics tools that match your specific needs, considering how different types of business users will interact with them. The right combination of tools helps analysts process data efficiently while making insights accessible to everyone who needs them.
Ultimately, success with BI depends on more than technology – it requires creating an environment where business intelligence analysts can effectively support decision-makers with data-driven recommendations. This means helping employees across departments understand how to use these tools to solve their daily business problems.
Implementing BI involves coordinating people, processes, and analytics tools, which many organizations find challenging. At Decision Foundry, we work alongside companies during their BI projects, helping them select and implement the right analytical tools while building internal capabilities. Our approach ensures teams can turn large amounts of data into actionable insights that improve business outcomes.
Steps to Develop a BI Strategy
Time spent mapping out your business intelligence strategy pays dividends in faster decisions, clearer insights, and better outcomes. While many organizations rush to implement the latest BI tools, successful projects start with a clear understanding of what success looks like for each department and user. Some teams may need real-time operational dashboards, others require deep analytical capabilities, and executives often want high-level views with drill-down options. A thoughtful strategy ensures your BI implementation meets these varied needs while maintaining data quality and security. The following steps create a framework for building a BI system that delivers practical value across your organization.
- Define Clear Objectives: Clearly articulate the goals and desired outcomes you aim to achieve with your BI initiatives. Ensure that these objectives align with your overall business strategies.
- Identify and Collect Relevant Data: Determine the key data sources that are crucial to your operations and establish a reliable process for collecting and storing this data. This may involve consolidating information from disparate systems into a central repository.
- Prioritize Data Quality and Integrity: High-quality data is fundamental for sound decision-making. Implement measures to cleanse data of errors and inconsistencies, and ensure that data is consistent in format and structure.
- Select Appropriate BI Tools: Choose BI software that meets your specific needs and budget. Consider factors such as ease of use, scalability, and integration capabilities with existing systems. Leading options include PowerBI, SAP BusinessObjects, and Tableau.
- Design Informative Dashboards and Reports: Create user-friendly, interactive dashboards and reports that provide decision-makers with a clear and actionable overview of relevant information. Tailor these visuals to the specific roles and responsibilities of each user.
- Implement Robust Security Measures: Prioritize data security by restricting access to authorized personnel and implementing measures such as role-based permissions, encryption, and regular backups.
- Monitor, Evaluate, and Adapt: Regularly assess the effectiveness of your BI strategy and make adjustments as needed. Stay informed about emerging trends and technologies in the BI landscape to maintain a competitive edge.
BI in Action – A Customer Success Story
A leading training and development organization approached Decision Foundry with a pressing challenge: understanding and improving their customer retention rates across multiple service lines. With diverse program offerings and inconsistent data sources, they needed a clear view of what drove customer loyalty and where opportunities for improvement existed.
The Challenge
The business struggled with fundamental data issues that prevented meaningful analysis of their customer base. Their information lived in multiple disconnected systems, making it impossible to track customer journeys effectively. Complex service structures also made customer segmentation a significant challenge, while measuring the impact of trial programs on retention remained out of reach. Without a unified view of their data, valuable insights remained hidden.
Our Solution & Results
Working closely with their teams, Decision Foundry developed a comprehensive BI solution using Tableau’s visualization capabilities. Our solution addressed:
- Data Integration: Created a centralized repository that unified all customer data sources
- Standardized Definitions: Established clear taxonomies for services and customer segments
- Interactive Dashboards: Built visualization tools that revealed trends and patterns in customer behavior
- Performance Tracking: Implemented KPIs to measure the impact of retention initiatives
Through these focused efforts, the organization achieved a 30% lift in retention rates and identified two new revenue streams for growth. The robust data governance framework we implemented ensures ongoing data quality and consistency, while our custom dashboards continue to make complex relationships clear and actionable for decision-makers.
This success story demonstrates how combining the right BI tools with proper data governance and analytics expertise can unlock hidden opportunities and drive measurable business growth. The organization now uses these data-driven insights to make informed decisions about their service offerings and customer engagement strategies.
Ready to Put Your Data to Work?
Business intelligence and business analytics are not interchangeable terms. Understanding their unique strengths and applications is essential for organizations seeking to drive growth and improvement.
Though they differ in focus and methods, BI and BA share a common purpose: helping organizations make better decisions based on data. Putting these tools to effective use requires the right combination of sound data management practices, appropriate technologies, engaged stakeholders, and a willingness to turn insights into action.
Decision Foundry understands the distinct challenges and benefits of implementing BI and BA. Our knowledgeable team is committed to helping clients at every stage of their analytics journey, from those just getting started to those fine-tuning mature capabilities. If you’re looking to use BI and BA to make better decisions and achieve your goals, we’re ready to help. Get in touch with us to discuss how our pragmatic, customized approach to analytics can work for you.
Schedule some Time ⟶Frequently Asked Questions
What role does predictive analytics play in shaping future strategies for businesses?
Predictive analytics plays a crucial role in shaping future strategies for businesses. By using historical data and statistical algorithms, predictive analytics can forecast future outcomes. Moreover, by analyzing trends and patterns, businesses can make informed decisions, anticipate market changes, optimize operations, and develop effective strategies to stay ahead of the competition.
What are the key benefits of using business analytics and business intelligence in a company?
Both business analytics and business intelligence can help companies make data-driven decisions, improve efficiency, and gain a competitive edge. As a result, they enable businesses to identify trends, predict outcomes, optimize operations, and ultimately increase profitability by leveraging insights from data analysis.
In what ways have advancements in artificial intelligence impacted the field of business analytics and business intelligence?
Advancements in AI have significantly transformed business analytics and intelligence by enabling real-time data analysis, predictive modeling, and personalized insights. Specifically, AI algorithms can process vast amounts of data quickly, leading to more accurate decision-making and improved business strategies.


