Build Better Datorama Dashboards
Datorama Dashboards need to be optimized for effective in-depth reporting across teams.
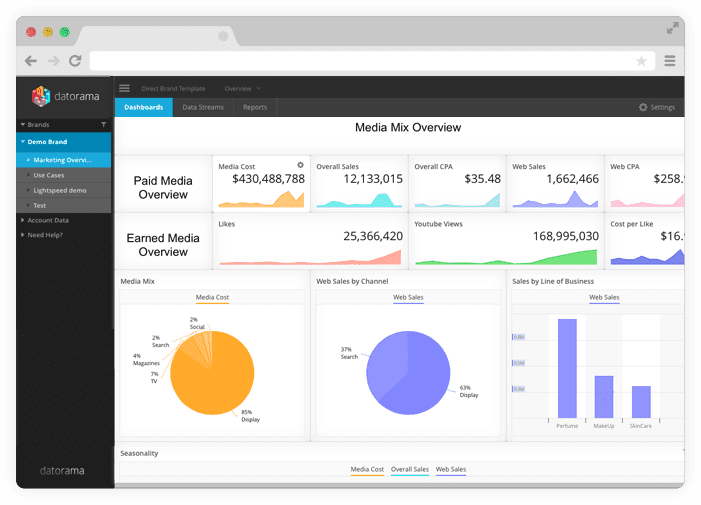
Organizing exhaustive marketing data from disparate sources into a centralized view has posed a serious operational problem for marketers everywhere. It has been a daunting task to unify and connect dynamic marketing data streaming from multiple locations as well as formats. Datorama is a marketing data platform that has engaged over thousands of marketers worldwide and it puts you in charge of your data by creating real-time Marketing Datorama dashboards for better marketing intelligence.
Datorama Dashboards are specially designed to simplify your task as a marketer.
How do they do this?
- By helping shape-up your marketing reports effectively for each contributor in the organization.
- By enabling cross-channel visibility and control through effective collaboration with different teams.
- By optimizing market performance through right KPIs (Key Performance Indicators) and metrics.
With so much at stake in terms of Data Integration, Data Classification and Data Modeling to run, analyze and optimize the campaigns, Datorama dashboards are essential for benchmarking performances and highlighting campaign KPIs. And so to avoid mishaps like Dashboard Page Crash for live campaigns or likewise, Datorama Dashboards should be optimized over time.
We have a few important points to help you optimize your Datorama Dashboards and there are two key areas where this has to be done.
- Page Setup
- Filtering
Datorama Dashboard Page Setup Tips
- Consider a set-up across several pages, rather than one page with a very extensive list of widgets. Fewer widgets will load quicker for a better user experience.
- Only display data at the necessary granularity as per KPI. E.g. if weekly tracking is sufficient, don’t display at a daily level.
- The Rich Text widget is great for design, however do not use too many within one page or performance will notably slow.
- Ensure that the Rich Text widgets only contain dimensions or measures which are used to represent data. Time comparison widgets often query a lot of data so don’t include too many on one page.
- Many widgets at the top of a page (e.g. many status widgets) can affect page load times, so limit to the necessary widgets only
Datorama Dashboard Filtering Tips
- Filter only by the necessary time periods. Lengthy time windows affect performance.
- Use check boxes if possible; complex rules like ‘not contain’ can slow things down causing performance issues.
- Apply Interactive Filters to relevant widgets only
- Set Default Filters if possible when using Interactive Filters, it is better for user experience.
With digital marketing turning more complex in the last few years and spanning multiple channels, data issues are following suit and real marketing insights are getting more challenging. But the fact that Data Integration, Data Modeling and Data Classification is the foundation of your system and can impact your organization right at the bottom level, it cannot be overlooked. AI powered Datorama is the single source of truth that can actually make sense of your marketing data and an extensive library for all your API (Application Programming Interface) connections.
Nothing shouts marketing and sales alignment better than the Datorama Dashboard and to know more about how to optimize these Marketing Dashboards, contact us here. Our Datorama experts will be happy to guide you


