Datorama dashboard examples can be hard to find and much of the content available is undifferentiated. We specialize in delivering quality data experiences using Datorama and our portfolio is broad and truly unique.
Marketers really are technical matchmakers, connecting target consumers with products and solutions that best meet their needs. They must coordinate consumer segments with the content, messaging, creatives, offers, and calls to action that best resonate across relevant platforms and channels. Datorama’s cloud-based platform helps marketers deal with these challenges in a user-friendly, data-focused way.
Generally, the barriers to understanding how customers engage with marketing campaigns, and where and how to optimize them, can be difficult to navigate, particularly in the absence of or too much data. Data visualization, preparation, charts, dashboards, and stats, are the areas where expensive and talented marketing resources are misaligned. It is common for even highly experienced marketing analysts to spend too much time preparing data rather than analyzing it.
“Marketers are challenged to measure and analyze results to improve and optimize campaigns to find the most efficient and impactful dimensions across channels, audiences, partners, and tactics. And this is no easy feat!”
Marketers must measure and analyze results to improve and optimize campaigns to find the most efficient and impactful campaigns. To do so, marketers must connect the dots across several marketing tools, buying platforms, reports, and KPIs. Business Intelligence solutions like Datorama, now called Marketing Cloud Intelligence offer dashboards, insights, and alerts across all channels, tools, and audiences as compared to conventional methods of manually creating static reports in excel or PowerPoint.
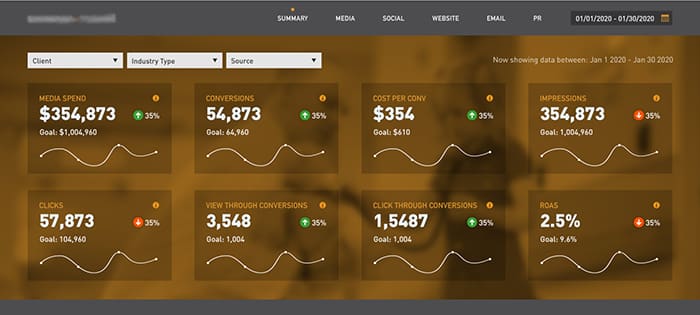
The Executive Overview
In this dashboard example, you can see a unified view for the main KPIs including spend, sales, ROI, and web traffic. This top-level, real-time view captures key metric performance at the campaign level and across channels. You can compare multiple campaign performances and dynamically drip down into further details. It provides the perfect dashboard for the executive level by including a good balance between high-level results with supporting details.
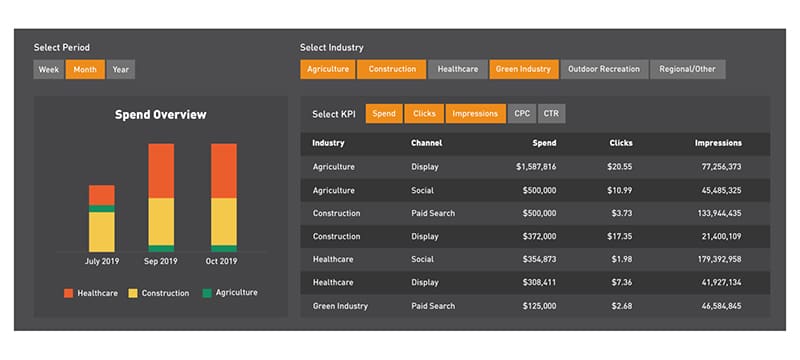
Datorama Dashboard Example: Cross-Channel Performance and Trends
Easily view sales volume, engagement, and web traffic across all key channels through Marketing Intelligence Dashboards, while also revealing cross-channel performance and trends. Here, users can compare spend with conversion to measure and optimize ROI. There is the option to compare the performance of campaign creatives and filter out the most efficient methods that best resonate with their target consumers. All this tracking of real-time data performance provides the knowledge needed to make changes and optimize campaigns.
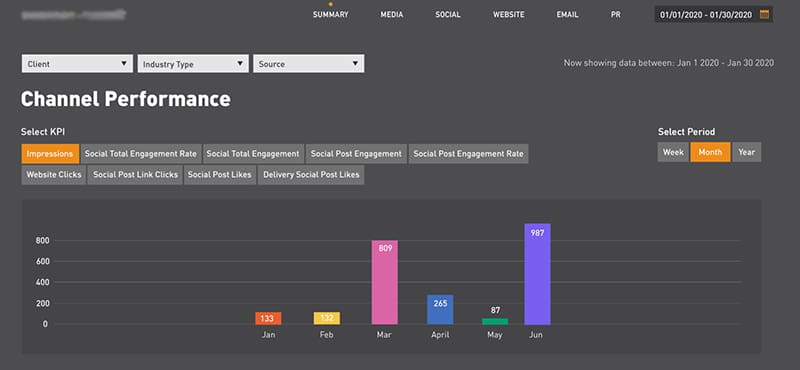
Datorama Salesforce Dashboard Examples: Cross-Channel Insights
Marketing intelligence dashboards harness the power of AI to help connect different data sources. Surfacing deep insights allows users to act across all channels, tactics, and targets to maximize future engagement, sales, and conversions.
Get access to campaign performance to find what is driving the most positive business impact, and where to optimize further. This will develop a sustainable relationship with the targeted audience, whether the marketing objective includes attracting, retaining, or engaging customers.
How to Create Interactive Datorama Dashboards
Marketers can create Datorama dashboards using the Visualize tab in the Datorama workspace. There are three elements to it – dashboards, dashboard pages, and widgets. One dashboard can contain multiple pages and each page can contain multiple widgets. Dashboards and dashboard pages can be organized using collections to suit a company’s requirements and dashboard themes and templates can be designed to make the process efficient. See a dashboard example of a recent Automotive client, below. Everything shown below was created in Datorama using Data Canvas.
Learn more about how to create custom dashboards in Datorama.
How Decision Foundry Can help you Build Better Dashboard Experiences
We know what slows marketing decision making and we’ll show you how to overcome it.
There are 5 Data Design Principles we use to create an optimal data experience while meticulously aligning with our client’s requirements and approved technical solutions. However, Publishers often provide exceptions where our process requires truly creative, strategic thinking.
Partner with Datorama’s leader in platform integration. We will document, build, and automate a new reporting solution for you, or extend the value of your existing reporting set up.


