Efficiency is key to boosting Datorama Page Performance. A slow dashboard can cause bottlenecks and headaches. Let’s explore some best practices to getting the most out of your dashboard.
It happens. Over time, dashboard dashboard performance begins to lag. The more charts, widgets, calculations and historical data processed the slower the page can become over time. It’s not a Datorama thing, you may have a query performance problem. But where should you begin? Before we get into the nitty gritty, let’s look at the basics of the dashboard loading process. The time it takes to load a dashboard page depends on the number of queries being made. Speed is also impacted by the query size (or the average number of rows being queried) versus the number of queries Datorama handles per millisecond.
Certain browsers are indeed far better at compiling code, but several other factors may impact Datorama page performance. For our purposes, we’ll dive into a few of the more important ones.
Datorama Dashboard Page Performance Issues and Solutions
1. Page Level and Widget Level Filters
Number of Filters Applied
It makes sense that more filters equal less data and faster page loading, but this is not the case. The more page level filters mean more queries being executed to surface the right data. Make sure unnecessary filters are not added to the dashboard, especially if they don’t impact the final output.
Granularity
Based on filter granularity, the number of rows queried might be higher than the number of rows required for a graph/ table. For example, a graph that contains Campaign Level Data only needs to query the campaign table.
Calculated Dimensions
It’s not advised to use calculated dimensions as filters because this calculation happens on the entire queried data set after the filtration takes place. Alternatively, filtering done on a mapped dimension directly surfaces filtered data and reduces query length and time. Re-immerse dimensions wherever possible so that predefined values are filtered.
2. Calculated Dimensions and Measurements
Granularity
When granularity is added to calculated dimensions and measurements, it impacts how the query is executed. This is because the number of queried rows is based on the lowest granularity called in the calculation.
Complexity
Complexity here refers to difficulty of the query caused by the calculation. Complex calculations require data to be queried from various different tables and/or entity levels. An example of this would be using “CustomUse_All Metrics” as a filter on widgets. To avoid complicating the query, this had to be reduced to a lighter version called “All Metrics (Lite)”.

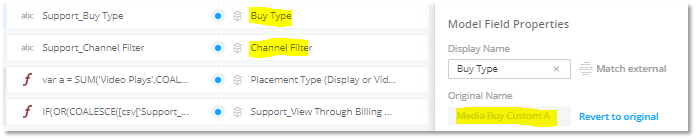
Window Functions
Specifying a data range for a calculation to consider is called a Window Function. Calculations that contain Window Functions impacts the performance of the queries. The best example of this would be a “SUM” function where the “GroupBy” dimensions are set. Therefore, Let’s look at an example of how this can be avoided. Assuming the below calculations needs to be optimized:
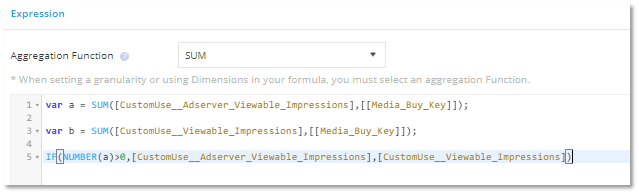
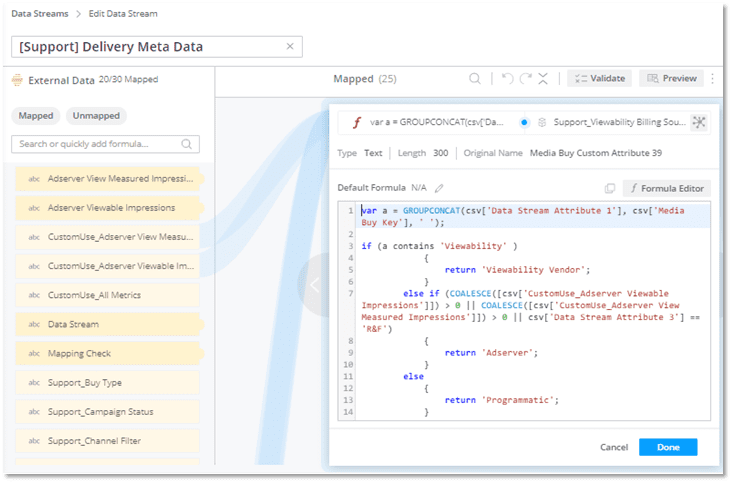
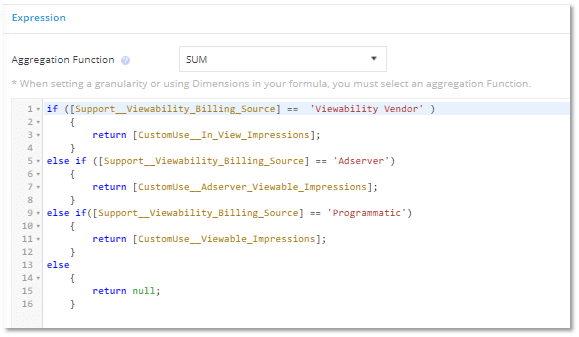
In the above example, the calculation uses Window Functions to decide between AdServer and regular, viewable impressions. In this case, Window Functions can be avoided if we store decisioning logics within mapped dimensions used in the final formula.
3.MTC Dimensions and Measurements
MTC dimensions and measurements will have an adverse impact in the following scenarios:
Mapping Granularity
The granularity that the buy data is mapped to the delivery data impacts the number of rows between connections needed, which make queries heavier.
Flight Period
Regardless of which page level filters are used, whenever IO and delivery data are being queried, the entire flight period is scanned to make all relevant calculations before surfacing relevant data. So, larger flight periods will lead to larger date ranges across IO and delivery data is being queried.
Overlapping IOs
These cause incorrect data and adversely impact page loading. If pages containing MTC data are loading slowly, consider re-immersing the data. Although this involves additional effort, it can lead to significant page load times improvement.
4. Entity Health
Entity-to-Fact Ratio
In layman terms, maintaining entity-to-fact ratio means ensuring that the number of entity keys in Datorama are kept to reasonable limits. The higher the number of fact data rows each entity key has, the better. For example, let’s say Media Buy Key “A” has data for five days. This means the entity-to-fact ratio would be 1/5 or 0.2. The higher this ratio, the more it adversely impacts page loading.
Zombie Keys
These are keys that no longer serve any purpose and do not have any fact data against them. Since Datorama stored all entity values in separate tables, it is useful to delete such zombie keys from time to time.
Datorama page performance depends largely on data stream load times, platform response, and query execution. There are a lot of calculations happening within a dashboard. By following these best practices, you’ll be able to speed up your performance and get more accurate queries.
Decision Foundry Can Help Datorama Page Performance
Decision Foundry is a Salesforce, independent software vendor, managed services provider, and a certified award-winning Salesforce Marketing Cloud integration partner. Decision Foundry closes the gap between data accessibility, platform adoption and business impact. Our consulting services include the integration of Data Cloud, Account, Engagement, Personalization, Tableau, and Intelligence.
Still stuck, book a consultation today to see what we can do to speed up your Datorama dashboards and improve your Marketing Cloud Intelligence investment.


