Tableau is a data visualization platform that focuses on Business Intelligence (BI), the analysis of business information. It has become very popular in recent years because of its flexibility and visual appeal. This BI tool lets organizations gain insights from their data and build visualizations from them. Tableau is well known for its intuitive visualizations and ability to exploit advanced analytical features, even for users without a technical background. It is available as a completely managed cloud-based service called Tableau Online and as an on-premises server-based deployment called Tableau Server. Here, we’ll provide examples of better dashboards created on Tableau, which are some of the easiest and interactive tools for visualizing data.
First, let’s understand about the core of Tableau. Tableau has basically three parts: Worksheet, Dashboard, and Story. Each Worksheet contains visualization flowing from either from different or the same data sources. Dashboard is a collection of views from multiple worksheets, and the integrated display of all worksheets. Story contains a sequence of worksheets and dashboards that work together to convey information. The arrangement of these components can be done vertically or horizontally. The magic of visualization happens at dashboard, which is brought to live after creating more than one worksheet.
Tableau Dashboard helps you in highlighting your company’s KPIs, depending on the business questions being asked, and the end-user. Dashboard actions, filters, and parameters, are the best tactics because they provide a way to transfer control of the data analysis from you to your client. Tableau provides one of the most effective ways to analyze data from any business process including sales, returns, purchase orders, warehouse operation, customer behavior, and more.
Points to remember while designing insightful and impactful Tableau Dashboards:
- The dashboard should focus on the goals based on client requirements
- Dashboard layout impacts effectiveness; placement of elements on dashboard design
- Design with drill to the lowest level of detail
- Choose a chart type that best suits the focused goals
- Understand color types and how to use them
- Maximize actionable insights by minimizing dashboard objects on the workspace
- Know the correct use of navigational types: select, hover, and menu
- Use only the required visual elements and keep it easy for users to understand
- Make sure that users understand your visualization
Being a leading Business Intelligence (BI) tool, Tableau provides a lot of options to create informational dashboards. Let’s take a look at some Tableau dashboard examples:
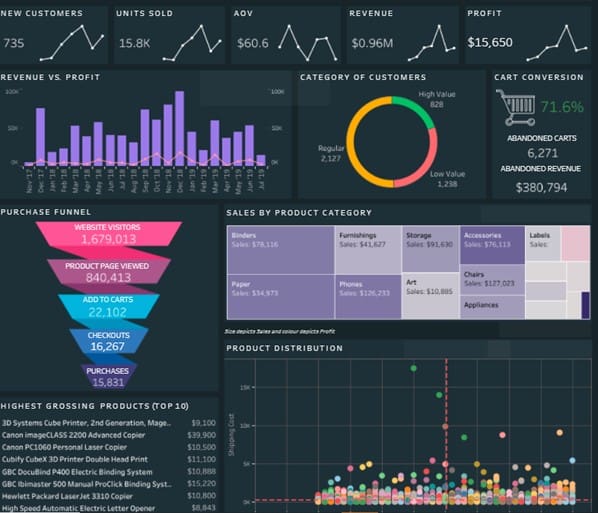
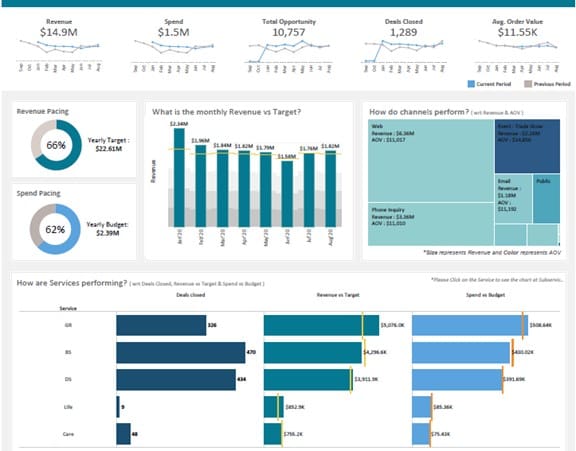
Sales Dashboard
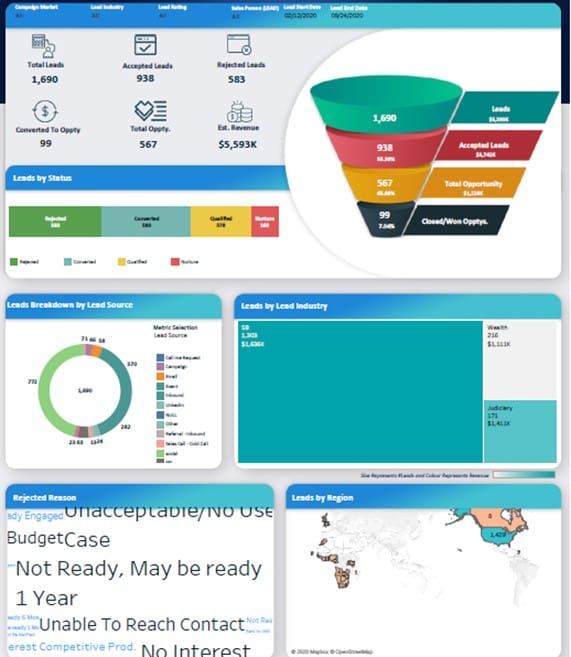
Leads Dashboard
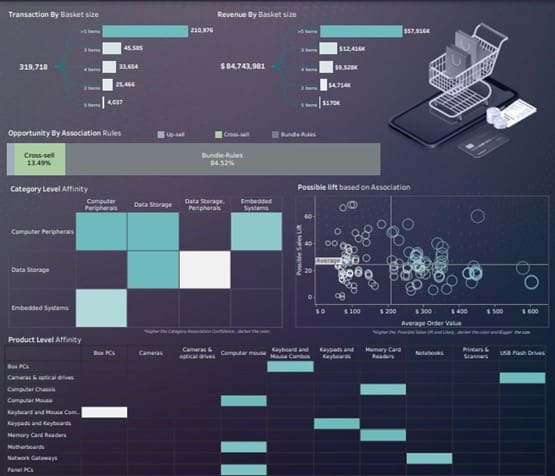
Market Basket Analysis
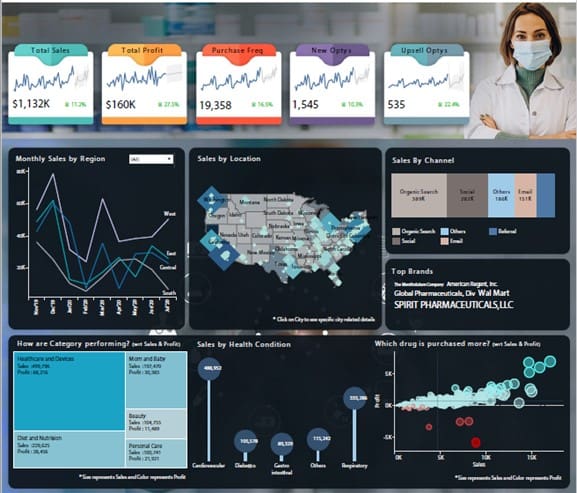
Pharma Dashboard
Executive Dashboard
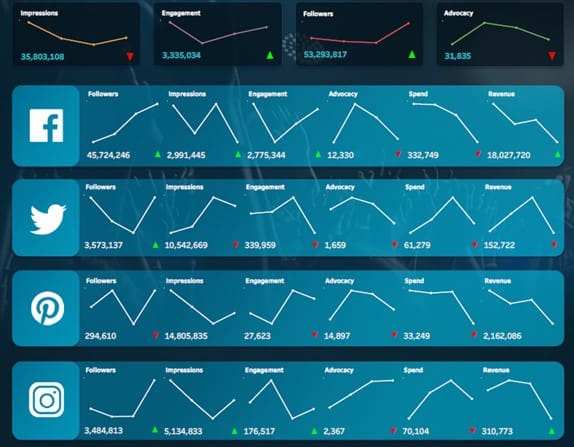
Social Overview Dashboard
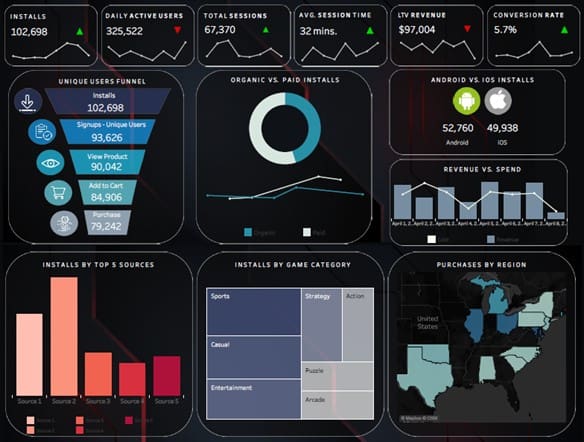
Game Publisher Overview
Benefits of the Tableau Dashboard
- Help users absorb information quickly through images and charts
- Trends obtained from the dashboards saves time and energy on analysis
- Quickly relay messages, trends, and data
- You can easily update your data or share insights
- Easily spot outliers to improve the accuracy and lessen the errors
- Save reporting time
- Bring disparate data sources together, increase visibility, and consolidate in a single location
Simplify your analysis and data exploration with Decision Foundry. We have delivered 100+ Tableau implementations across multiple industries. Our expert BI team will efficiently scale your Business Intelligence with its proactive and result-oriented strategic approach.
Benefits of Working with Decision Foundry
- Collaboratively work with Tableau experts and Certified Professionals
- Proprietary DETA framework with 100+ implementations, and counting
- Unmatched data user experience that yields deep insights
- Augmented dashboards through advanced, AI-enhanced analytics for deeper understandings
Partner with one of Tableau’s leaders in dashboard management for expert Tableau Consulting. We document, build, and automate a new reporting solution for you, or extend the value of your existing reporting infrastructure. Reach out for a quick start.
Frequently Asked Questions
How many charts should a Tableau dashboard contain?
Aim for three to five views per dashboard. Fewer, well-chosen charts keep the story clear and the dashboard fast, while too many objects create clutter and slow load times. If you need more detail, split the content across multiple dashboards connected by navigation buttons or drill-down actions instead of cramming everything into one screen.
Should I use tiled or floating layout in Tableau dashboards?
Tiled layouts are the safer default: objects snap into a grid, resize predictably, and are easier to maintain as the dashboard evolves. Floating objects are best reserved for small overlays such as logos, legends, or filter panels placed over whitespace. Mixing many floating elements makes alignment and responsive behavior harder to control.
What size should I design a Tableau dashboard for?
Use a fixed dashboard size that matches how your audience will view it — 1200 x 800 pixels is a common desktop choice. Fixed sizing renders consistently and performs better than automatic sizing. If users will open the dashboard on phones or tablets, add device-specific layouts in Tableau's Device Designer rather than relying on one size for every screen.
How can I improve the performance of a slow Tableau dashboard?
Start by reducing the number of worksheets, filters, and high-cardinality quick filters on the dashboard, then use extracts instead of live connections where freshness allows. Aggregating data to the level you actually display and using action filters instead of many global filters also helps. For complex or enterprise-scale deployments, an experienced partner such as Decision Foundry's Tableau consulting team can audit and tune your workbooks.


