- Overview of Dynamic Zone Visibility in Tableau
- How it is different from Parameters and Actions in Tableau
- Use cases and examples of Dynamic Zone Visibility.
1. Overview of Dynamic Zone Visibility in Tableau
We all want to have a Dynamic Dashboard and it is always better than a static one. We want to interact with the dashboard based on the selection that the users are making or based on the regions or geographies from which the users are logging in.
Using the Dynamic Zone Visibility feature we can hide or reveal zones that could be tiled or floating on our dashboard and create this interactivity based on the values of a field or parameter.
When we combine this with parameter actions, we can swap sheets or create unique visuals that can cater to different kinds of audiences for our dashboard.
1.1 Dynamic Zone Visibility in Tableau supports only a few types of field.
- Boolean (True/False, Yes/No, 0/1)
- Single Value
- LOD that returns constant values.
Anything else that is not supported would not be shown on our control visibility using Options under the layout menu. So if we want data to be shown or used for Dynamic Zone Visibility, we must make sure that it follows or supports one of these three above field types.
2. How it differs from Parameters and Actions in Tableau.
Dynamic Zone Visibility can be controlled by either a field or a parameter. Tableau states that these must be Boolean, single value, and/or independent of a visual. In other words, you can think of Dynamic Zone Visibility as a switch that’s either “On” or “Off”.
Parameters can be used in conjunction with dashboard parameter actions to control an object’s visibility. For example, a user clicking on a mark opens a hidden container with more details about that mark. A field can be used if a view is only relevant for a certain user group or category of data. Since Dynamic Zone Visibility is controlled automatically, users won’t need to customize the dashboard for their use case.
To summarize, we must create a calculated field which takes in the value of the parameter and then use that on the shelf (Filter) to make sure that we are able to interact with it.
We don’t really have to create this calculated field over the parameter to do. How Dynamic Zone Visibility works is we just have to go to Layout, then click control visibility, then select the created parameter. This is how we can interact with the dashboard using parameter with the help of Dynamic Zone Visibility, without creating a calculated field over it.
3. Use cases and examples of dynamic zone visibility.
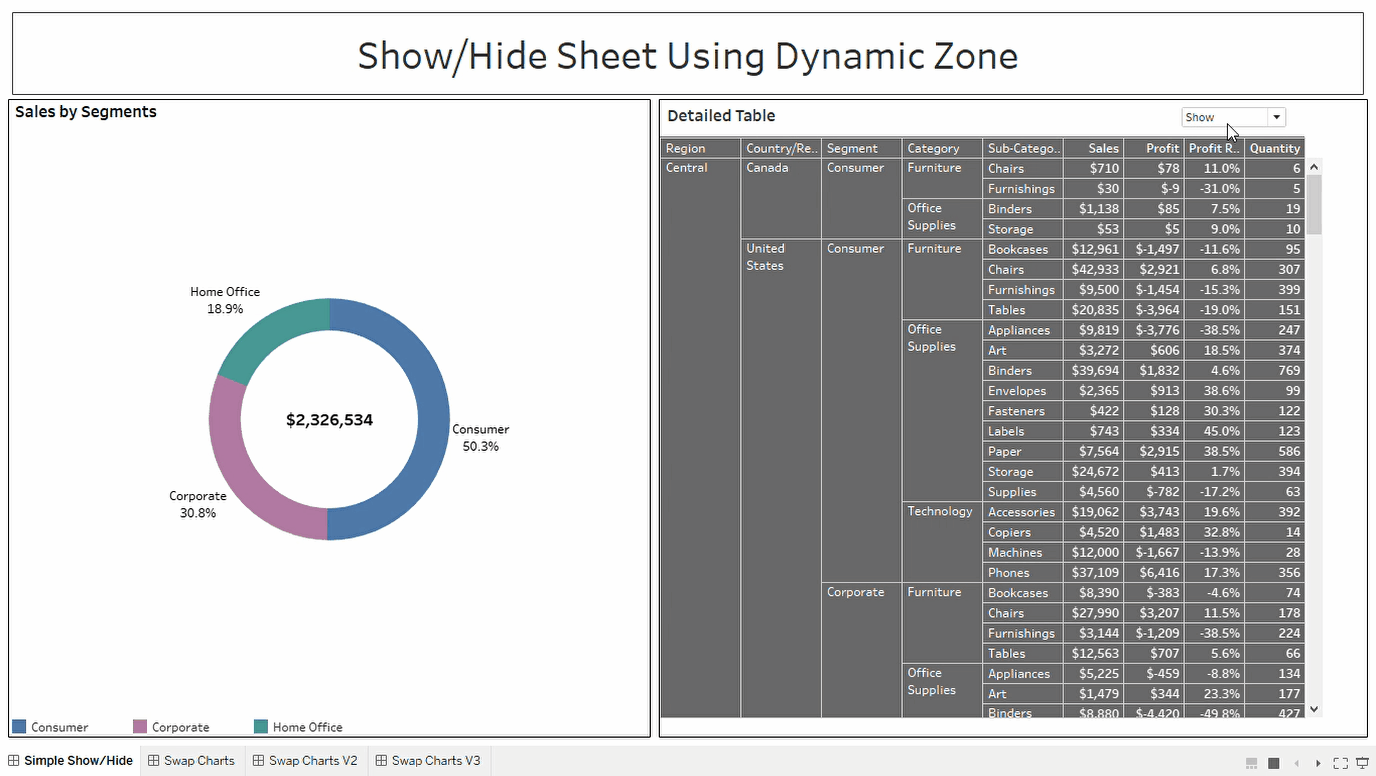
- Show/Hide views on the dashboard.
- Swapping sheets based on the parameter selections.
- Change the Dashboard views based on chart selection.
About Decision Foundry
Decision Foundry is a Salesforce, independent software vendor, managed services provider, and a certified award-winning Salesforce Marketing Cloud integration partner. Decision Foundry closes the gap between data accessibility, platform adoption and business impact. Our consulting services include the integration of Data Cloud, Account, Engagement, Personalization, Tableau, and Intelligence.


