Tableau App: Dynamic Sunburst Charts visualize hierarchical data and provide quick summaries for quick insight viewing.
For a long time, Tableau allowed users to develop custom visuals within the limit of its native features. Tableau Jedis have explored that option quite well, and we can see a zillion brilliant visuals on platforms like Tableau Public. But was that enough? When all other platforms provided options for custom-built layers over an existing product, in the form of plug-ins and widgets, Tableau kept away. But sure enough, Tableau opened up the possibility of developing extensions by launching the Extension SDK.
What is a Tableau Extension?
Tableau Extension is a plug-in, or application, that can run within the Tableau environment. It is a file with the JavaScript library, provided by Tableau, and the code to create a new feature or widget that works in Tableau.
Dynamic Sunburst Chart
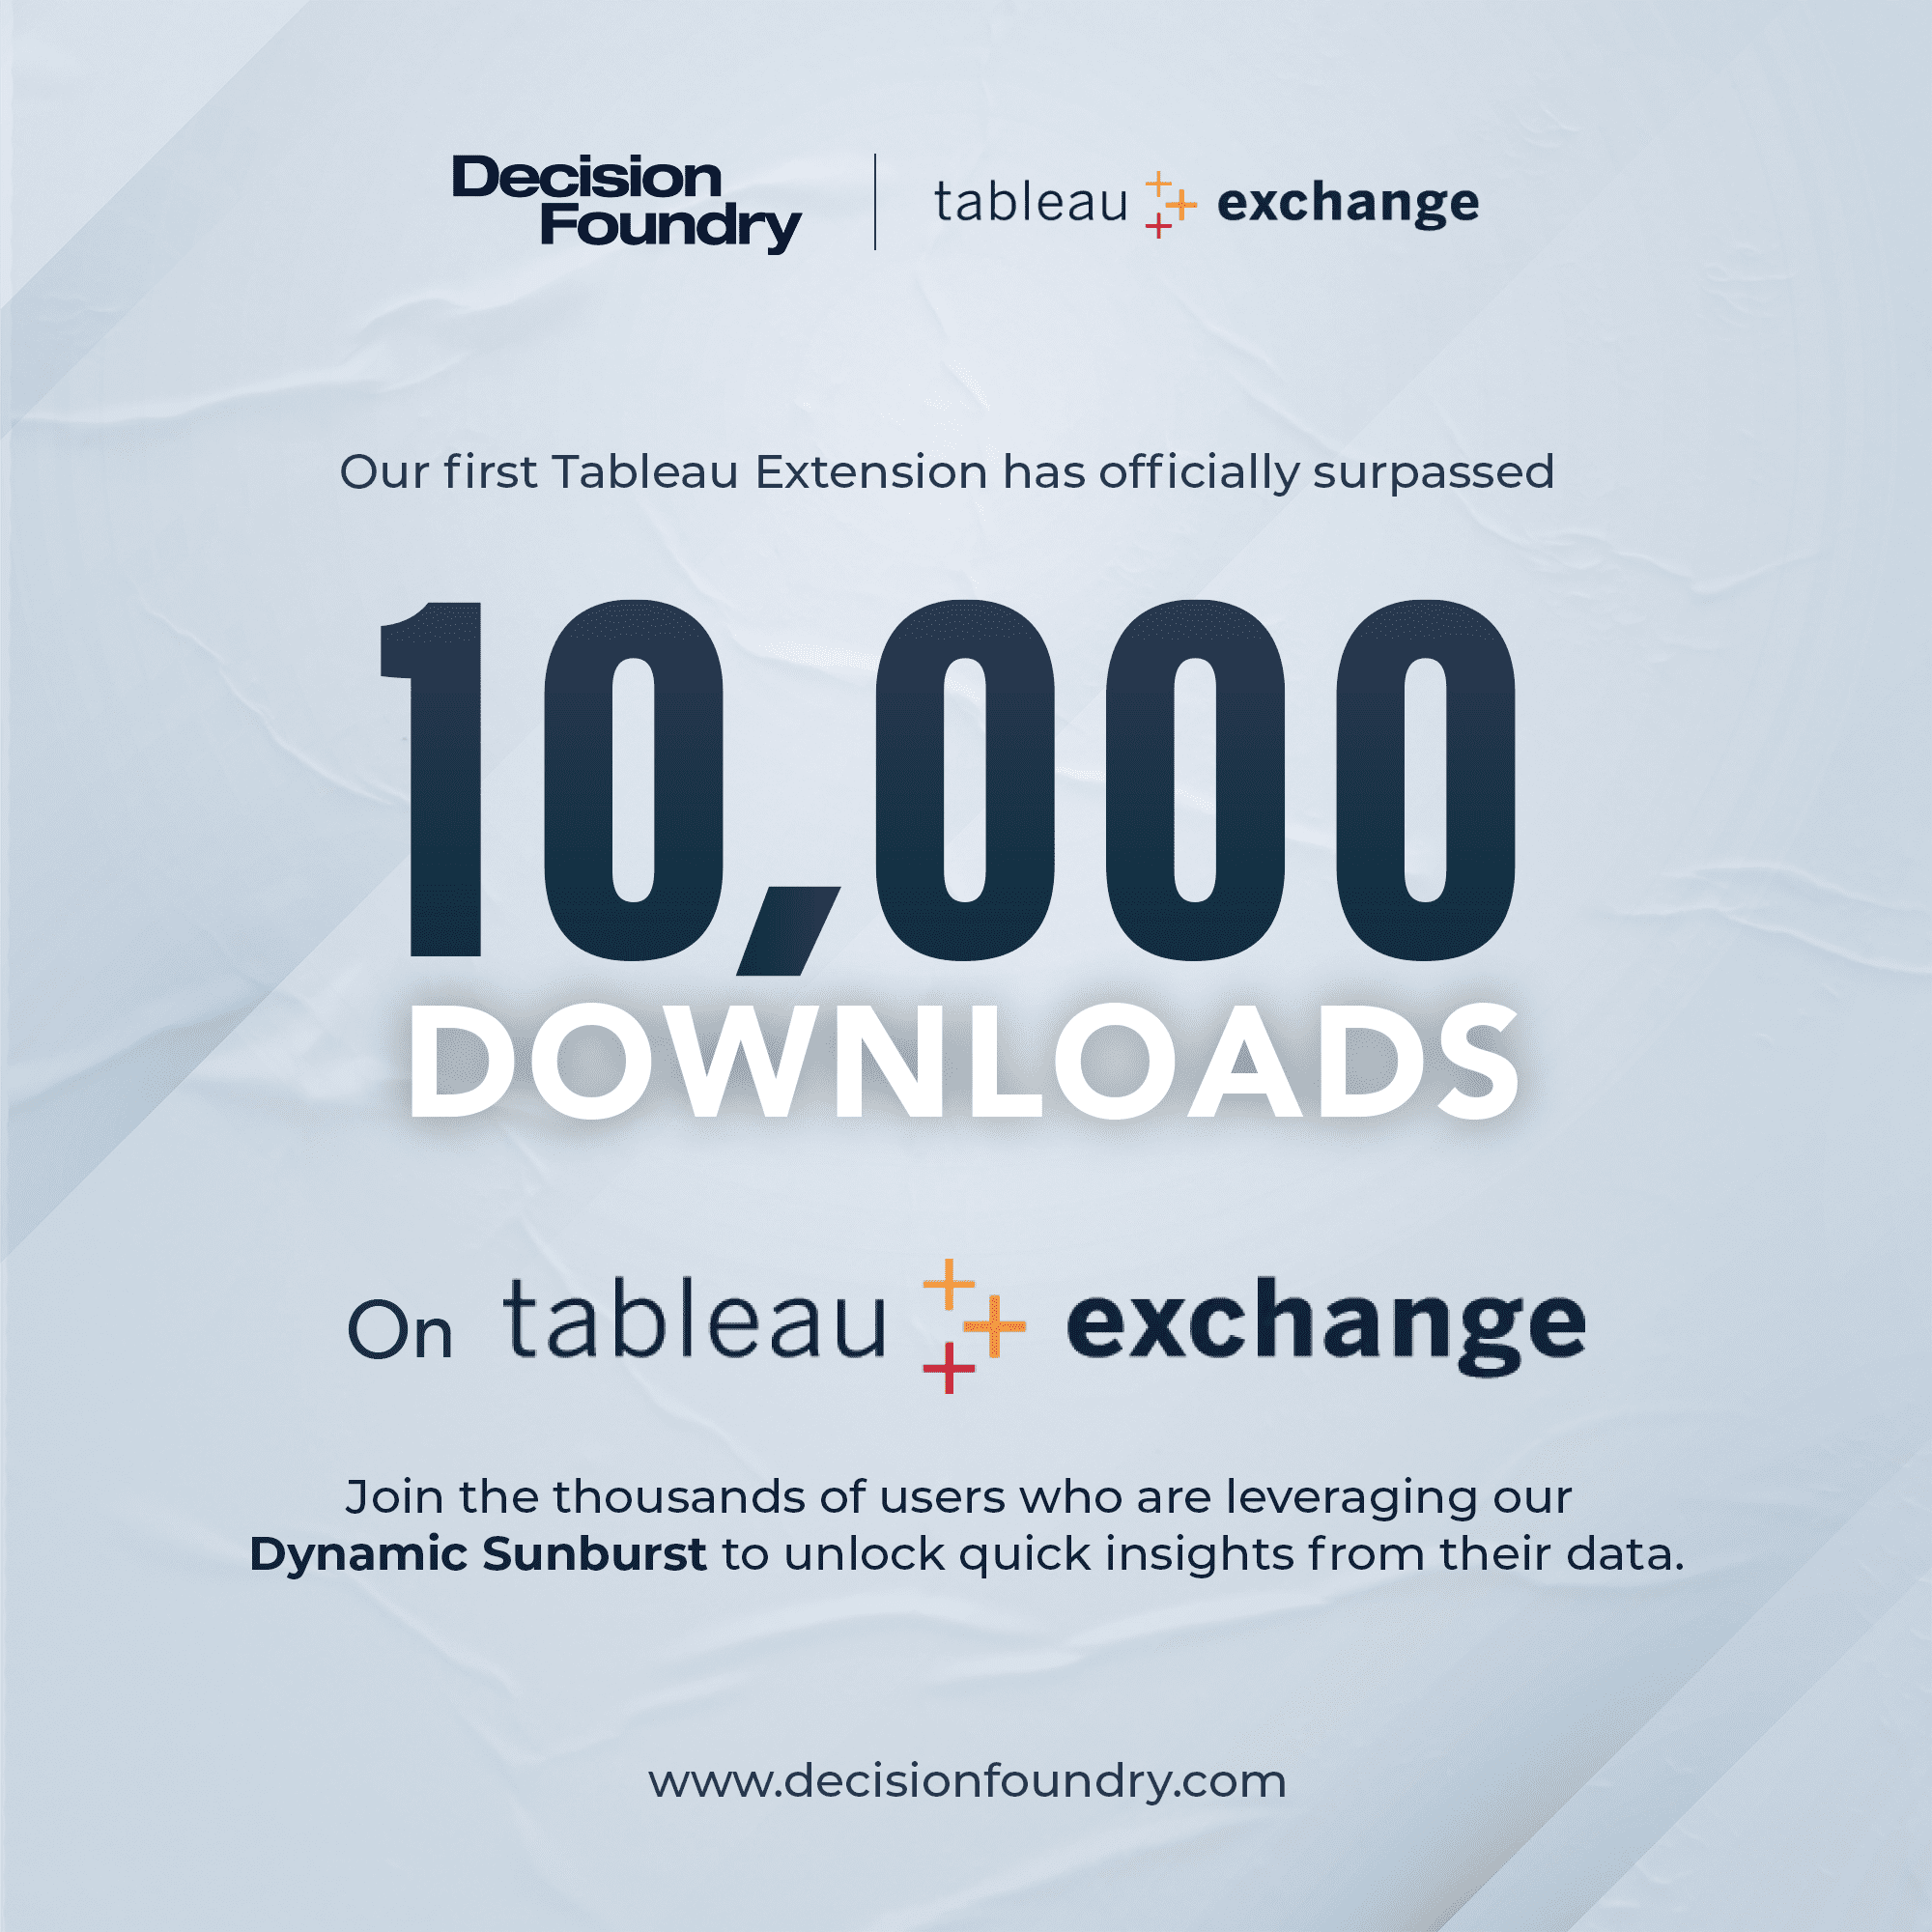
The Dynamic Sunburst Chart, which can be found at that link, is a Tableau extension built and maintained by Decision Foundry. As of November 29th, 2022, it is the second most downloaded dashboard extension on the exchange.
Sunburst charts visualize hierarchical data and provide quick summaries. But, in most cases when the breakdowns are at each level, inference gets more difficult. That’s the problem the Dynamic Sunburst Chart is trying to solve. By adding the ability to drill down, the chart helps the user get high-level and individual, element-specific from the same graph or widget. After a quick configuration, the extension visualizes your data as a Sunburst Chart. Any interaction on the chart will drill it down to the next level.
With an automated dimension selector, the chart’s configuration can be done in a jiffy. The metric names are the only input the user needs to change in the configuration window. We can select one or two metrics. If two are chosen, the widget will have a dropdown at the top right corner to switch between the metrics.
Benefits
• Quick and easy to configure
• Ideal for visualizing hierarchical data
• Interactive with meaningful color coding
• Responsive resizes according to container size
How to configure and use the extension?
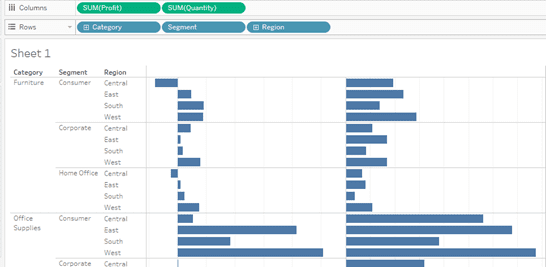
First, we need to create a sheet to hold all the dimensions and metrics required. Ideally, this extension requires three dimensions and up to two metrics to be functional. But, if the first dimension or the top level of the hierarchy has only one value, we can include four dimensions. While creating the input sheet on Tableau, avoid “Measure Values” on column or row shelves. The following screenshot can be an excellent reference to understand what the Sunburst Chart expects from an input sheet.
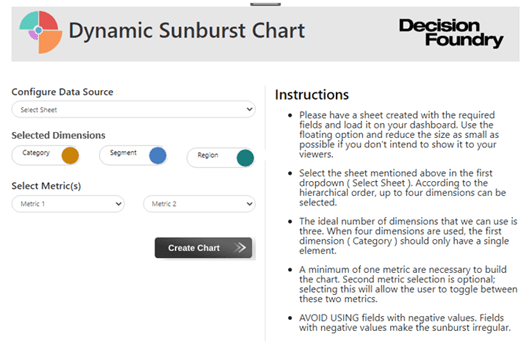
Once the sheet is created, load the sheet on your dashboard. If you don’t intend to show it to your viewers, use the floating option to reduce the size as small as possible. Now it’s time to load the extension file (.trex) and have the sheet selected from the “Configure Data Source” dropdown.
Once the sheet is selected, the available dimensions are automatically populated. The color schemes will also be auto-selected, but the user can change this by clicking on the circular color icons next to each dimension. The final step is selecting the metric(s) and hitting the “Create chart” button.
A few tips to consider:
• The ideal number of dimensions that we can use is three. When four dimensions are used, the first dimension (Category) should only have a single element.
• A minimum of one metric is necessary to build the chart. A second metric selection is optional. Selecting this allows users to toggle between these two metrics.
•AVOID USING fields with negative values. Fields with negative values make the Sunburst irregular.
About Decision Foundry
Decision Foundry is a Salesforce, independent software vendor, managed services provider, and a certified award-winning Salesforce Marketing Cloud integration partner. Decision Foundry closes the gap between data accessibility, platform adoption and business impact. Our consulting services include the integration of Data Cloud, Account, Engagement, Personalization, Tableau, and Intelligence.


