Customer retention analysis is a process of measuring how loyal and satisfied customers are with a product or service over a specific period of time. A common method for conducting customer retention analysis is cohort analysis, which groups customers based on shared characteristics or experiences and tracks their behaviour over time.
What is Cohort Analysis?
Cohort analysis is a method of grouping customers based on a common characteristic or event, such as the date they subscribed to, signed up for, or purchased your product. For example, you can create a cohort of customers who bought your product in December 2021, and another cohort of customers who bought your product in February 2022. Then you can compare how many customers from each unit remained active users after one month, two months, three months, etc. This can help you understand the retention patterns and differences between the groupings and their possible causes. In cohort analysis, month 0 usually represents the month when the customer joined or made their first purchase.
How do I go about it in Datorama?
So, for this exercise, let’s take a sample retail dataset that has these columns:
- Customer ID
- Invoice Date
- Invoice Number
- Product Description
- Quantity
Preview of how our dataset for this exercise would look like:

We are using a dataset that contains the categories ‘Customer ID’, ‘Invoice Date’, ‘Product Description’, and ‘Quantity’. We will create cohorts based on the month of the first purchase. For example, if 10 customers bought items for the first time in December 2021, they will belong to the cohort named “Dec 2021”.
We will create a generic data model named as “Cohort Analysis” to ingest this dataset.
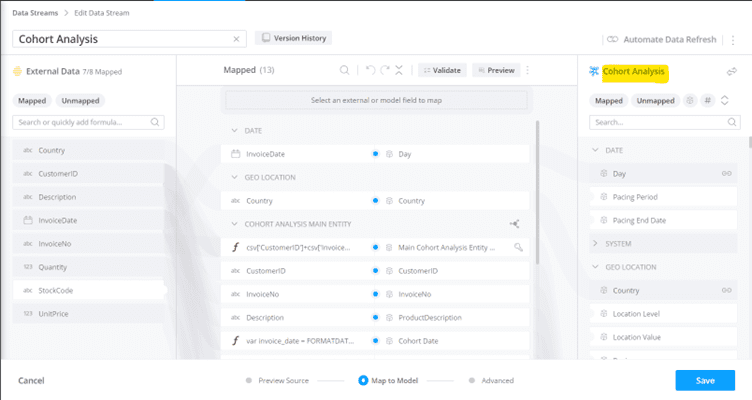
We need to create a Cohort Date attribute for our Main Entity Key (TotalConnect) in the Generic Data Model named “Cohort Analysis”. The Cohort Date will show the month of the first purchase for each customer. To do this, we can use the GROUPCONCAT function in Datorama to join all the Invoice Dates for each Customer ID in ascending order. Then we can extract the first date from the concatenated string as the Cohort Date. (See screenshot below for the mapping of Cohort Date)
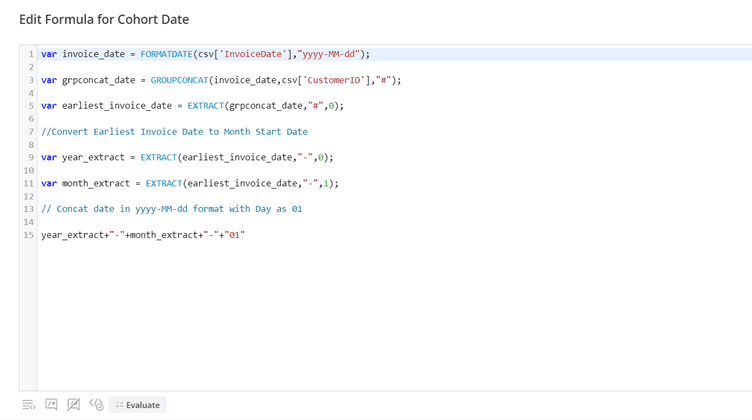
To perform cohort analysis, we need to calculate a key metric called “Cohort Index”. This metric shows how many months have passed since the customer’s first purchase. To calculate the Cohort Index, we need to create two more attributes in our Generic Data model: “Cohort Month” and “Cohort Year”. These attributes indicate the month and year of the customer’s first purchase.
Please Note: Month 0 means the month of inception or the month when the customer was acquired. You would be seeing Month 0 while validating/previewing your mappings in TotalConnect.
Let’s calculate Cohort Month using the month from Cohort Date and month from Invoice Date at an individual row level. This is a preview of the mapping of Cohort Month, which would be an attribute of the Main Entity Key.
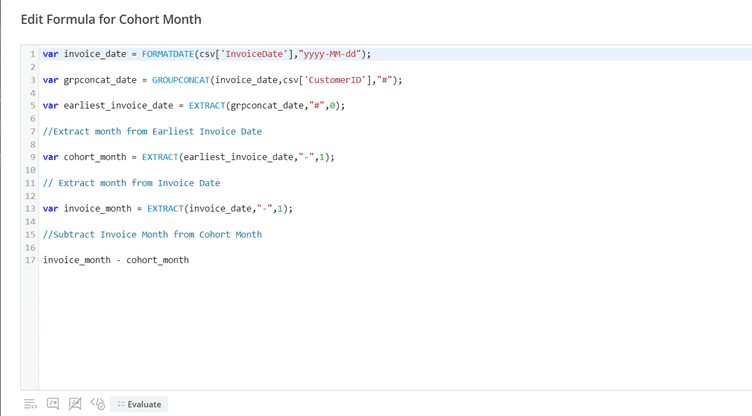
Here is a preview of the mapping of Cohort Year, which would be an attribute of the Main Entity Key as well:
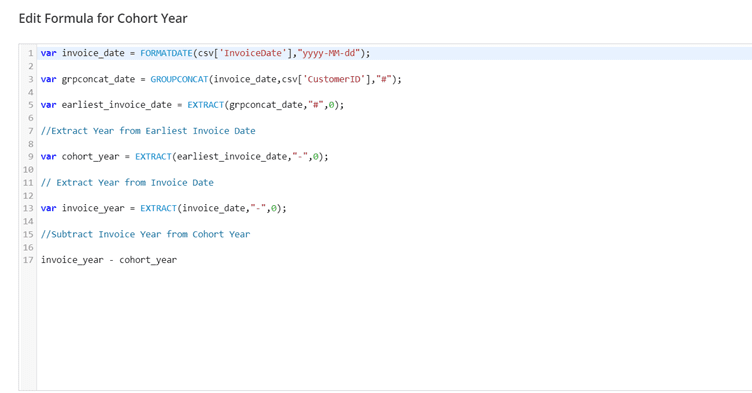
Now, we have calculated Cohort Month and Cohort year at an individual row level. These 2 attributes will help us in computing the Cohort Index.
The formula to calculate Cohort Index is: Cohort Index = ((Invoice Year – Cohort Year) * 12) + (Invoice Month – Cohort Month)
Each row in our dataset will now be assigned an Index range between 0 to 12 under the column named Cohort Index.
(Mapping formula shared below for reference. We can use DAT fields in Datorama to avoid typing the same formula what we typed earlier to calculate Cohort Month and Cohort Year.)

Save the mapping of this Datastream and let it process its log file. Once the data is processed, take a pivot of this Datastream, and filter the pivot for a customer ID. You would notice that for a given Customer ID, each individual purchase is attributed to a Cohort Index which is calculated using the Invoice date.
In this Pivot, ‘Day’ is the Invoice Date, and the ‘Cohort Date’ is the very first purchase date (Month Start Date) associated to Customer ID: 12348. Cohort Index is the number of months passed by since this Customer made their very first purchase.

Let’s create a Transposed Pivot Table widget in a Datorama page with Cohort Date, Cohort Index and Distinct Count of Customer IDs as the supporting metric in this combination.
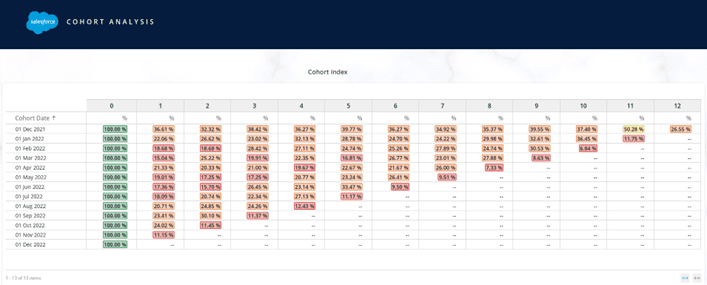
The Row dimensions on the extreme left are the Cohort Months (month start date) and the Column Dimensions on the top are the Cohort Index. If we glance through the first row, 885 customers made their first purchase in the month of Dec 2021. That’s the month of Inception, which is why 885 comes under the Column Dimension labelled as 0. Out of 885 customers, 324 customers were repeat customers who made another purchase in the month of January 2022. So, the retention rate for the First month after the Inception Month would be:
Retention rate = (number of returning customers / number of total customers) x 100
Where:
Number of returning customers = number of customers who made a repeat purchase or action in a given period.
Number of total customers = number of customers who made a first purchase or action in a given period.

Retention Rate (1st Month) = (324/885)*100 = 36.61%
Retention Rate (2nd Month) = (286/885) * 100 = 32.3% and so on..
In order to calculate Retention rate for all the Cohort Dates and its Cohort Indexes, we would re-immerse the data into a new Generic data stream. Let’s create a report in Datorama that will aid us in the re-immersion process.
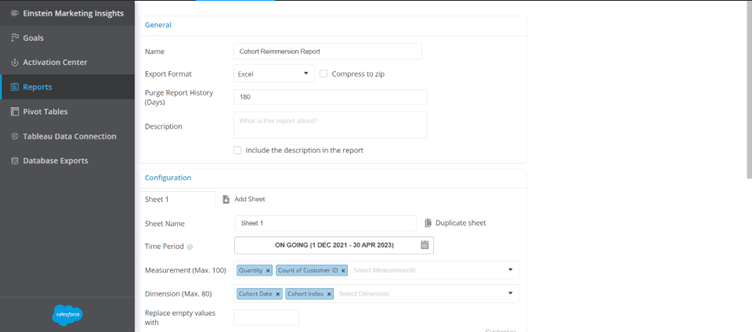
Create a report named as “Cohort Re-immersion Report” where the measurements that need to be pulled would be Quantity and Distinct Count of Customer IDs, and the dimensions that need to be pulled would be Cohort Date and Cohort Index.
(Sharing screenshot of the re-immersion report for reference)
Create a new TotalConnect Datastream that belongs to a new Generic data model named as “Cohort Re-immersion” and ingest the re-immersion report that we created in the previous step.
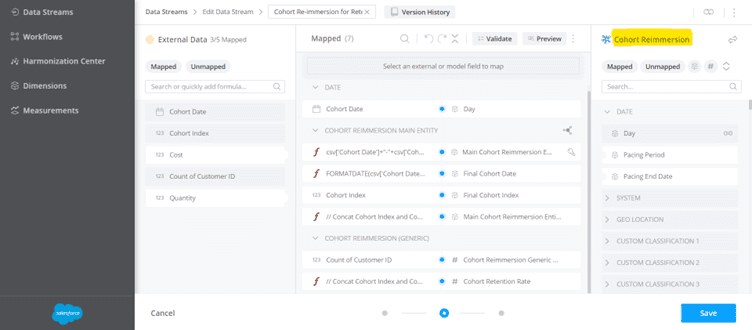
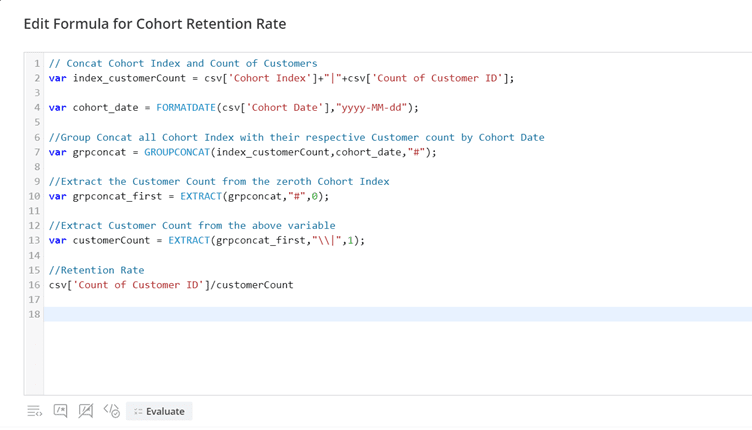
In order to calculate Retention rate for each Cohort date and its Cohort Index, we would need the GROUPCONCAT function to concatenate all Cohort Index and Distinct Count of Customer ID by Cohort Date.
To calculate the retention rate (%), we need to divide the distinct count of customer IDs for each index by the distinct count of customer IDs for the zeroth index. The zeroth index represents the cohort month and it will always be the first value in the Groupconcat string. We can extract this value and use it as the denominator for the retention rate formula.
(sharing the mapping of Retention rate for reference)
After all the heavy lifting in the backend, it’s time to visualize our Cohort Dates, and Cohort Indexes with Retention Rates (%) in Datorama’s table widget with some nice highlighting rules:
