Marketers tend to run multiple marketing campaigns to ensure that the products and services offered capture awareness, consideration and conversion. Considering that most campaigns involve spending a good portion of the marketing budget, it is necessary to understand and analyze how much impact marketing has had on the sales funnel compared to the overall investment typically, measured as Return on Invesment (ROI) or Return on Ad Spend (ROAS).
Marketing analytics and appropriately defined key performance indicators provide critical information to Marketers, and while PowerPoint and excel reports are traditionally the medium used to deliver analysis, these can be cumbersome to build and maintain. Building interactive templates may be an option.
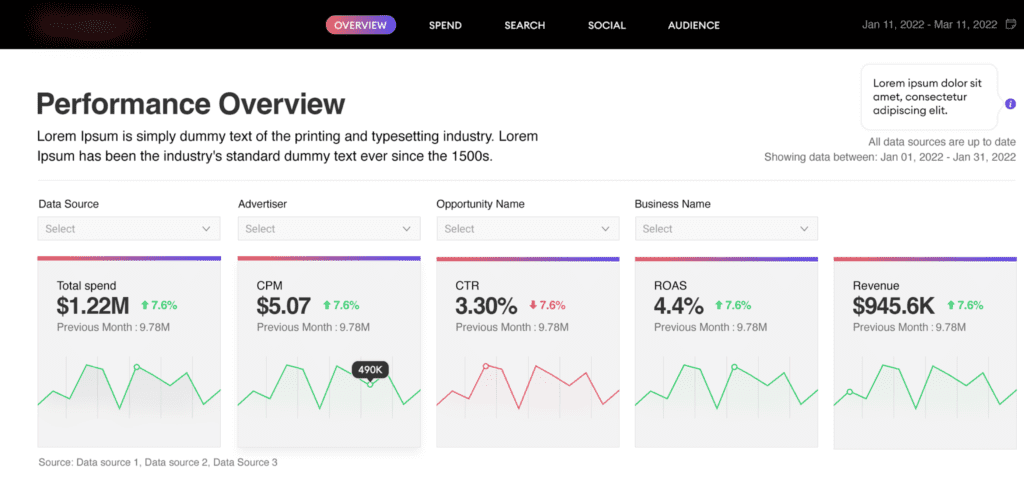
Dashboards can provide a scalable solution for campaign reporting and marketing analysis, whether it is SEO, paid search, or email marketing. Datorama, now called Marketing Cloud Intelligence also enables the integration of fragmented data from traditional marketing campaigns into interactive marketing dashboards using a variety of available Datorama data connectors. Take a look at our short portfolio of compiled examples in the video below.
How do you create interactive dashboards using Datorama?
Users can create dashboards using the Visualize tab in the Datorama workspace. It has three elements: dashboards, dashboard pages, and widgets. One dashboard can contain multiple pages and each page can contain multiple widgets. Dashboards and dashboard pages can be organized to suit a company’s requirements and templates can be designed to make the process efficient. Caution, don’t overdo it. Adding too many widgets to your pages and materially slow down the speed of your pages and impact dashboard adoption. See examples of Decision Foundry’s dashboards.
Building dashboards in Datorama
Once the dashboard and the necessary pages are created, you can use widgets to set up interactive dashboards. On the page, there is a “+” icon on the top right of the menu which once clicked will provide a widget library and the user can choose based on requirements such as tracking a metric or the status of a goal.
There are various options in widgets that will help the user interact with the data, such as: drill down, slice, exclude, or show/hide labels. See our Mastering Datorama Learning series to understand more about Datorama’s custom visualization capabilities. The interactive widgets let you filter data according to entities and date range. For example, if the user wants to see the media cost for a certain period, like a month or a quarter, it can be done using the interactive date widget. It is also possible to set up cascading filters that one filtering component can be applied to another interactive filter widget. Such filters help in the analysis of data, planning of resources and advancing the marketing strategy in the digital space.
It is also possible to add commentary to your dashboards using the “Rich Text Widget”. This can be achieved by creating the commentaries file, mapping it, and then displaying the commentaries. Doing so enables the user to attach unique descriptions, expected results and other notes to an entity. Download 12 Tips for Building a Better Data Experience in Datorama.
In Datorama, there is an option called “Genius” under the “Analyze & Act” tab which allows a user to generate several insights. These insights can then be exported onto dashboards to keep the stakeholders informed on developments correlated with the latest data retrieved in the platform.
Sharing Dashboards
Once the visualizations are created, they can be shared with the stakeholders. Even if they do not have an account on the Datorama platform, these visualizations can be embedded on a third-party website or can be shared via a link by editors and administrators. These embedded and shared pages display updated information identical to the page in the dashboard. Similarly, a widget can also be embedded (but not shared). It is also possible to set sharing rights as “Admins Only”, “Shared Specifically”, “Share With All” or “Read Only”. This is especially useful when sharing visualizations with stakeholders outside the company or when including visualizations in embedded devices such as TV screens or iPad Kiosks in public areas.
Creating a Template
Dashboard templates are ideal when you want to replicate your dashboard pages across your collections and workspaces. This is a popular tactic among agency users of the platform, but works well for all advertisers. To create dashboard templates in Datorama you must have the appropriate user role, first. Only Admins and Power Users can create Datorama templates. See many of our functional dashboards.
Maintenance
Over time, you’ll add KPIs, custom calculations, new widgets and even a little CSS to improve the overall aesthetic appeal and functionality of Datorama pages. Unfortunately, over time these improvements can slow page loads directly impacting page usability. Here are 4 tips you can take now to avoid Dashboard lag.
7 Steps to Creating a Dashboard Template
- Login as an Admin or Power User
- Go to the Visualize tab
- Select a collection
- Click Add New Page
- Select a Dashboard Template
- Search for or select the dashboard template you want to create a page for.
- After you click the dashboard template you want to create a page for, a new dashboard page is then created.
Summary
Datorama, now called Marketing Cloud Intelligence provides thorough visualization and interactive marketing dashboard solutions for key performance indicators like “cost per click” and “return on ad spend”. Datorama marketing dashboards can be adjusted for location, device, campaign and other such entities and can add value to every aspect of your marketing decision-making process.
About Decision Foundry
Decision Foundry is an award-winning, certified Datorama partner with four, recognized Marketing Champions and over fifty certified developers on staff. Please feel free to reach out to us for a demo of our dashboards.


